Monitoring AMS with Grafana
In this document, you'll learn how to monitor Ant Media Servers with Apache Kafka, Elastic Search and Grafana. So we need to install these components. Here is a step by step guide to install your monitoring system from scratch
- Use Automatic Installation Script
- Install Apache Kafka
- Install Elasticsearch and Logstash
- Install Grafana
Information about CVE-2021-44228
Since Apache Kafka uses Log4j 1.x, there is no impact[1]. If your Logstash and Elasticsearch version is lower than 7.16.1, you can upgrade to the latest version with the command
apt-get update && apt-get install -y logstash elasticsearch. If you do not have the possibility to update, you need to add the parameter-Dlog4j2.formatMsgNoLookups=trueto the JVM option.[1] https://logging.apache.org/log4j/2.x/security.html [2] https://discuss.elastic.co/t/apache-log4j2-remote-code-execution-rce-vulnerability-cve-2021-44228-esa-2021-31/291476
Which data can you access from Ant Media?
Ant Media Server provides the following statistics.
- instanceId
- cpuUsage
- jvmMemoryUsage
- systemInfo
- systemMemoryInfo
- fileSystemInfo
- jvmNativeMemoryUsage
- localWebRTCLiveStreams
- localLiveStreams
- localWebRTCViewers
- localHLSViewers
- encoders-blocked
- encoders-not-opened
- publish-timeout-errors
- vertx-worker-thread-queue-size
- webrtc-vertx-worker-thread-queue-size
- server-timing
- host-addres
Automatic Installation Script
If you would like automatic installation instead of dealing with the steps above, you can use the script below:
Usage:
wget https://raw.githubusercontent.com/ant-media/Scripts/master/install-monitoring-tools.sh && chmod +x install-monitoring-tools.sh
After the installation is completed successfully, login to Web panel http://your_ip_address:3000/ through your web browser. The default username and password is admin/admin
Install Apache Kafka
Kafka is useful for building real-time streaming data pipelines to get data between the systems or applications.
- Install Java because Apache Kafka requires Java.
apt-get update && apt-get install openjdk-8-jdk -y
- Download the Apache Kafka and then extract the archive file
    wget https://archive.apache.org/dist/kafka/2.2.0/kafka_2.12-2.2.0.tgz
    tar -zxvf kafka_2.12-2.2.0.tgz
    sudo mv kafka_2.12-2.2.0 /opt/kafka
- Edit server.properties
vim /opt/kafka/config/server.propertiesfile as below.
listeners=PLAINTEXT://your_server_ip:9092
- Start Apache Kafka
    sudo /opt/kafka/bin/zookeeper-server-start.sh /opt/kafka/config/zookeeper.properties &
    sudo /opt/kafka/bin/kafka-server-start.sh /opt/kafka/config/server.properties &
    sudo /opt/kafka/bin/kafka-server-start.sh /opt/kafka/config/server.properties &
Firstly, we've started ZooKeeper because Kafka needs ZooKeeper and then we've started Kafka.
- Check if it's working. Run the command below
netstat -tpln | egrep "9092|2181"
if you see that the ports(9092 and 2181) are in listening mode, it means it's working.
Run Apache Kafka as a systemd service.
Running Apache Kafka as a systemd service will let us manage Kafka services to start/stop using the systemctl commands. Follow the instructions below
- Create
systemdunit file for Apache Kafka
vim /lib/systemd/system/kafka.service
- Copy and paste the below content into the
kafka.serviceyou've created above. Make sure that you set the correct JAVA_HOME path for your system in the content below
    [Unit]
    Description=Apache Kafka Server
    Requires=network.target remote-fs.target
    After=network.target remote-fs.target kafka-zookeeper.service

    [Service]
    Type=simple
    Environment=JAVA_HOME=/usr/lib/jvm/java-1.8.0-openjdk-amd64
    ExecStart=/opt/kafka/bin/kafka-server-start.sh /opt/kafka/config/server.properties
    ExecStop=/opt/kafka/bin/kafka-server-stop.sh

    [Install]
    WantedBy=multi-user.target
- Create
systemdunit file for Zookeeper
vim /lib/systemd/system/kafka-zookeeper.service
- Copy and paste the below content to the
kafka-zookeeper.servicefile you've created above.
    [Unit]
    Description=Apache Zookeeper Server
    Requires=network.target remote-fs.target
    After=network.target remote-fs.target

    [Service]
    Type=simple
    Environment=JAVA_HOME=/usr/lib/jvm/java-1.8.0-openjdk-amd64
    ExecStart=/opt/kafka/bin/zookeeper-server-start.sh /opt/kafka/config/zookeeper.properties
    ExecStop=/opt/kafka/bin/zookeeper-server-stop.sh

    [Install]
    WantedBy=multi-user.target
- Enable and reload the systemd daemon to apply new changes.
    systemctl enable kafka-zookeeper.service
    systemctl enable kafka.service
- kafka server
    systemctl start kafka-zookeeper.service
    systemctl start kafka.service
Kafka settings for Ant Media Server
If you want to monitor Ant Media Server, you need to set the IP address of your Apache Kafka in AMS_INSTALLTION_DIR/conf/red5.properties file.
- Open the following line with the editor
vim /usr/local/antmedia/conf/red5.properties
- Edit the line:
server.kafka_brokers=ip_address:port_number
Replace
ip_address:port_numberwith Apache Kafka IP Address and port number. Example:server.kafka_brokers=192.168.1.230:9092
- Restart Ant Media Server.
service antmedia restart
- Check if it's working When you run the following command on Kafka server, if there is data flow, everything is configured properly.
/opt/kafka/bin/kafka-console-consumer.sh --bootstrap-server 192.168.1.230:9092 --topic ams-instance-stats --from-beginning
- Output should be something like below:
        {"instanceId":"a06e5437-40ee-49c1-8e38-273544964335","cpuUsage":
        {"processCPUTime":596700000,"systemCPULoad":0,"processCPULoad":1},"jvmMemoryUsage":
        {"maxMemory":260046848,"totalMemory":142606336,"freeMemory":21698648,"inUseMemory":120907688},"systemInfo":
        {"osName":"Linux","osArch":"amd64","javaVersion":"1.8","processorCount":1},"systemMemoryInfo":
        ...
        }
Some Useful Apache Kafka commands
- List all topics
/opt/kafka/bin/kafka-topics.sh --list --bootstrap-server your_kafka_server:9092
Example:
    /opt/kafka/bin/kafka-topics.sh --list --bootstrap-server 192.168.1.230:9092
    ams-instance-stats
    ams-webrtc-stats
    kafka-webrtc-tester-stats
- Monitor messages for a specific topic with Kafka Consumer as we've used above
/opt/kafka/bin/kafka-console-consumer.sh --bootstrap-server 192.168.1.230:9092 --topic ams-instance-stats --from-beginning
Install Elasticsearch and Logstash
Install Elasticseach
- Import GPG key and Repo
    wget -qO - https://artifacts.elastic.co/GPG-KEY-elasticsearch | sudo apt-key add -
    sudo apt-get install apt-transport-https
    echo "deb https://artifacts.elastic.co/packages/7.x/apt stable main" | sudo tee -a /etc/apt/sources.list.d/elastic-7.x.list
- Update package lists and install elastic search
sudo apt-get update && sudo apt-get install elasticsearch
- Enable and start elasticsearch service
    sudo systemctl enable elasticsearch.service
    sudo systemctl start elasticsearch.service
Install Logstash
Logstash is a server‑side data processing pipeline that ingests data from multiple sources simultaneously, transforms it and then sends it to a “stash” like Elasticsearch
- Update your package lists, then install
logstashwith the following command:
sudo apt-get update && sudo apt-get install logstash
- Enable logstash service
sudo systemctl enable logstash.service
- Configure logstash. Create
/etc/logstash/conf.d/logstash.conffile and add below content. Please don't forget to replacekafka_server_ipand make sureelasticsearch_ipis correct.
    #kafka
    input {
      kafka {
        bootstrap_servers =>` "kafka_server_ip:9092"
        client_id =>` "logstash"
        group_id =>` "logstash"
        consumer_threads =>` 3
        topics =>` ["ams-instance-stats","ams-webrtc-stats","kafka-webrtc-tester-stats"]
        codec =>` "json"
        tags =>` ["log", "kafka_source"]
        type =>` "log"
      }
    }

    #elasticsearch
    output {
      elasticsearch {
         hosts =>` ["127.0.0.1:9200"] #elasticsearch_ip
         index =>` "logstash-%{[type]}-%{+YYYY.MM.dd}"
      }
      stdout { codec =>` rubydebug }
    }
- Save and close the file, then restart
logstashservice
sudo systemctl restart logstash
Test Elasticsearch and Logstash Configuration
You can test that Elasticsearch and Logstash are working correctly with the command below.
curl -XGET 'localhost:9200/_cat/indices?v&pretty'
Example output:
    health status index                   uuid                   pri rep docs.count docs.deleted store.size pri.store.size
    yellow open   logstash-log-2020.03.23 mf-ffIHBSNO4s7_YoUr_Rw   1   1       1300            0    527.5kb        527.5kb
Install Grafana
Grafana is an open source metric analytics & visualization suite.
- In order to install Grafana Server, run the following commands.
    sudo apt-get install -y software-properties-common wget apt-transport-https
    wget -q -O - https://packages.grafana.com/gpg.key | sudo apt-key add -
    sudo add-apt-repository "deb https://packages.grafana.com/oss/deb stable main"
    sudo apt-get update && sudo apt-get install grafana
- Enable and start grafana server
    sudo systemctl enable grafana-server
    sudo systemctl start grafana-server
Configure Grafana
-
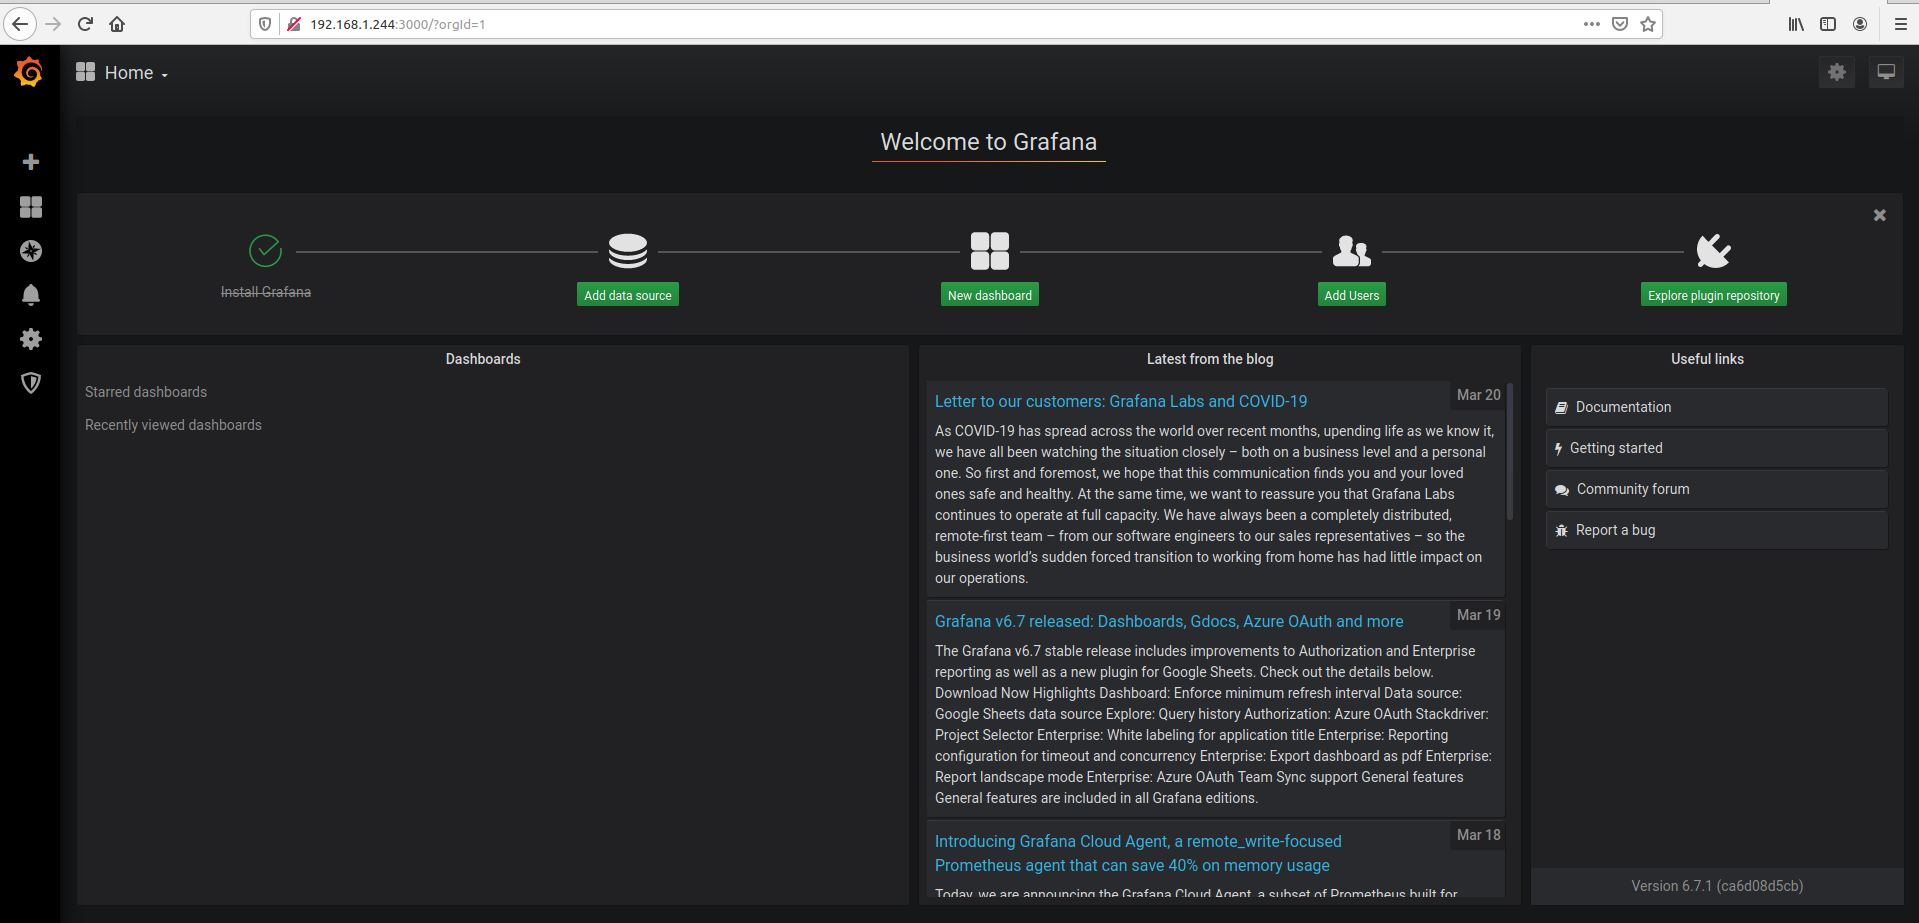
Login to Web panel
http://your_ip_address:3000/loginthrough your web browser. Default username and password isadmin/admin -
Click
Add data source.
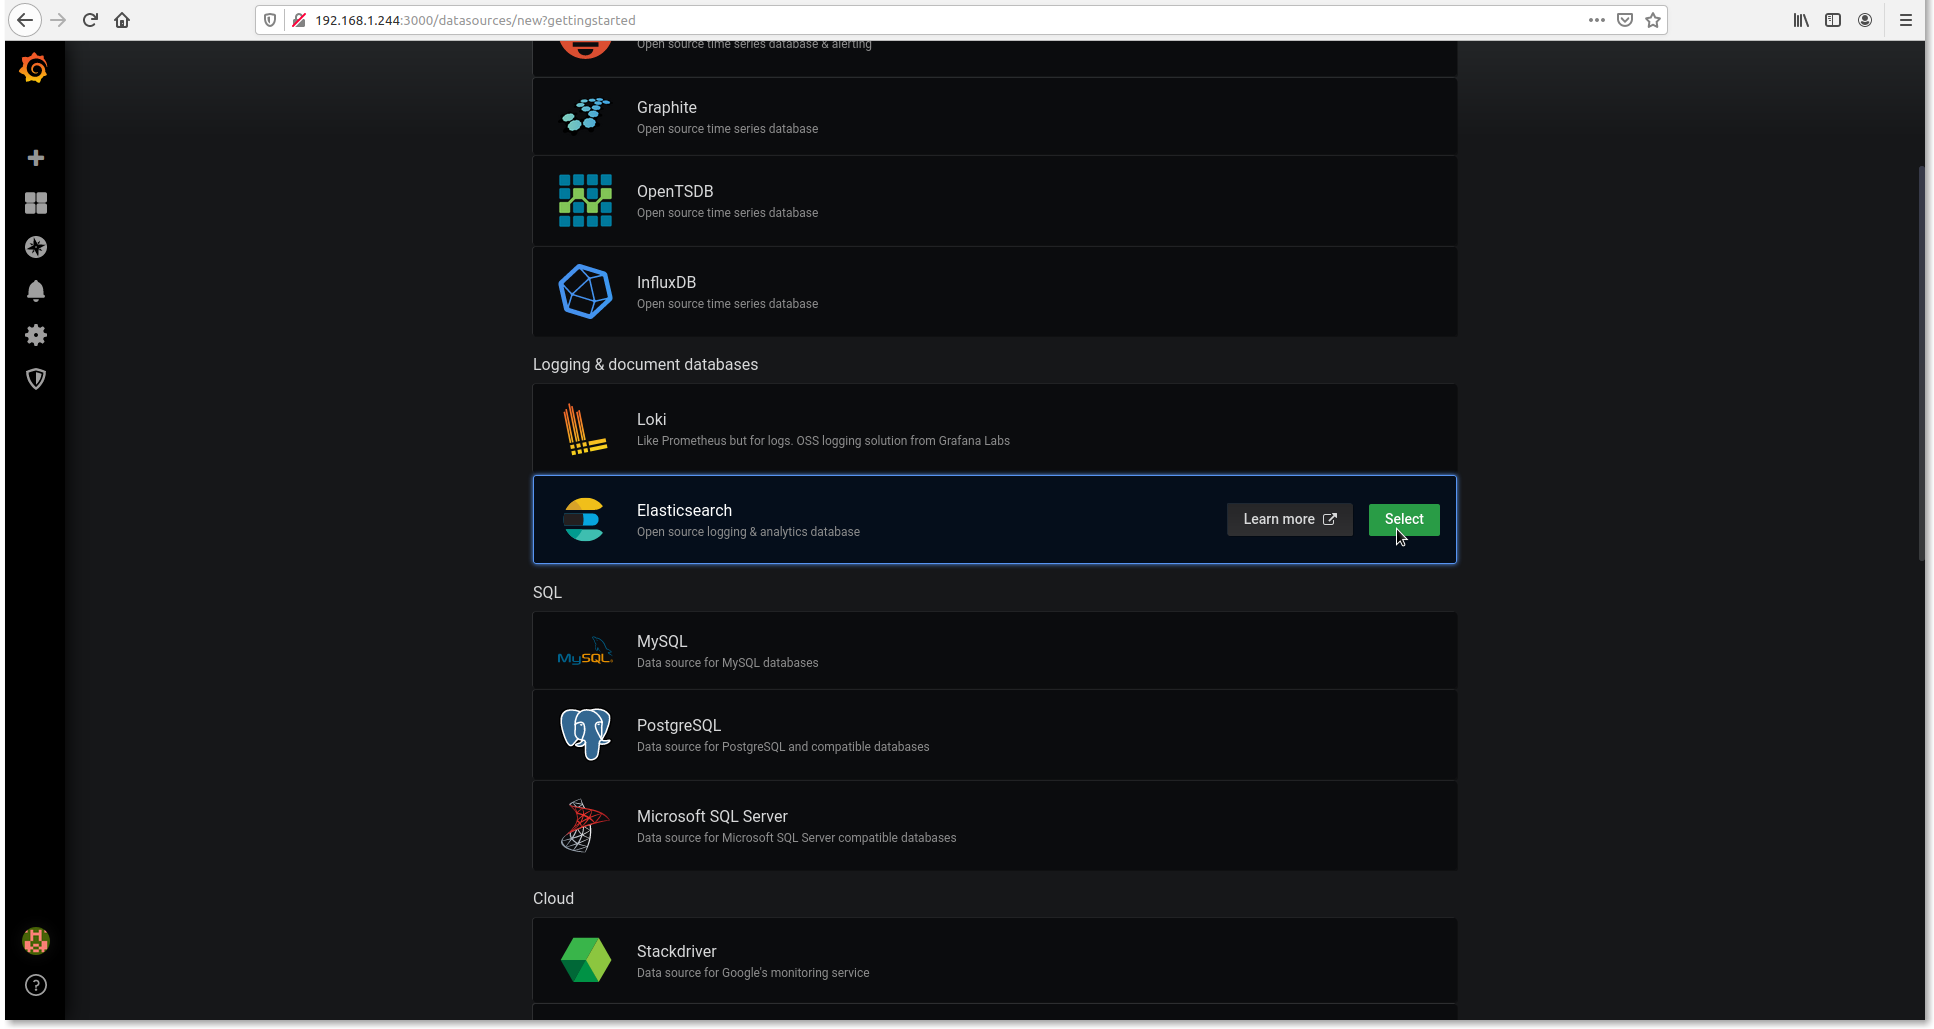
-
Select Elasticsearch
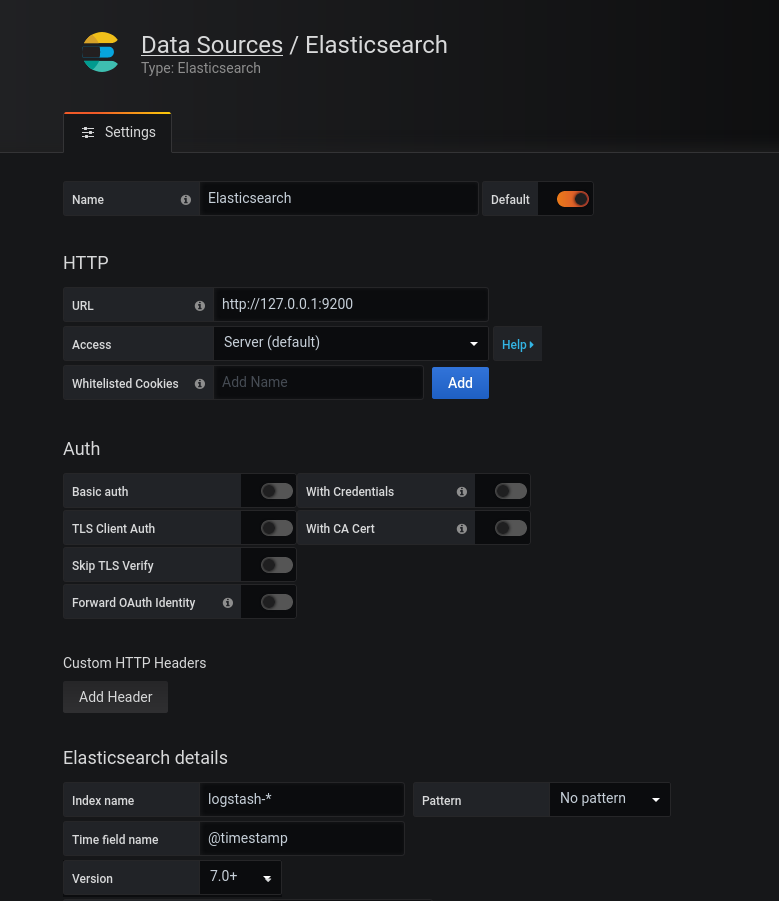
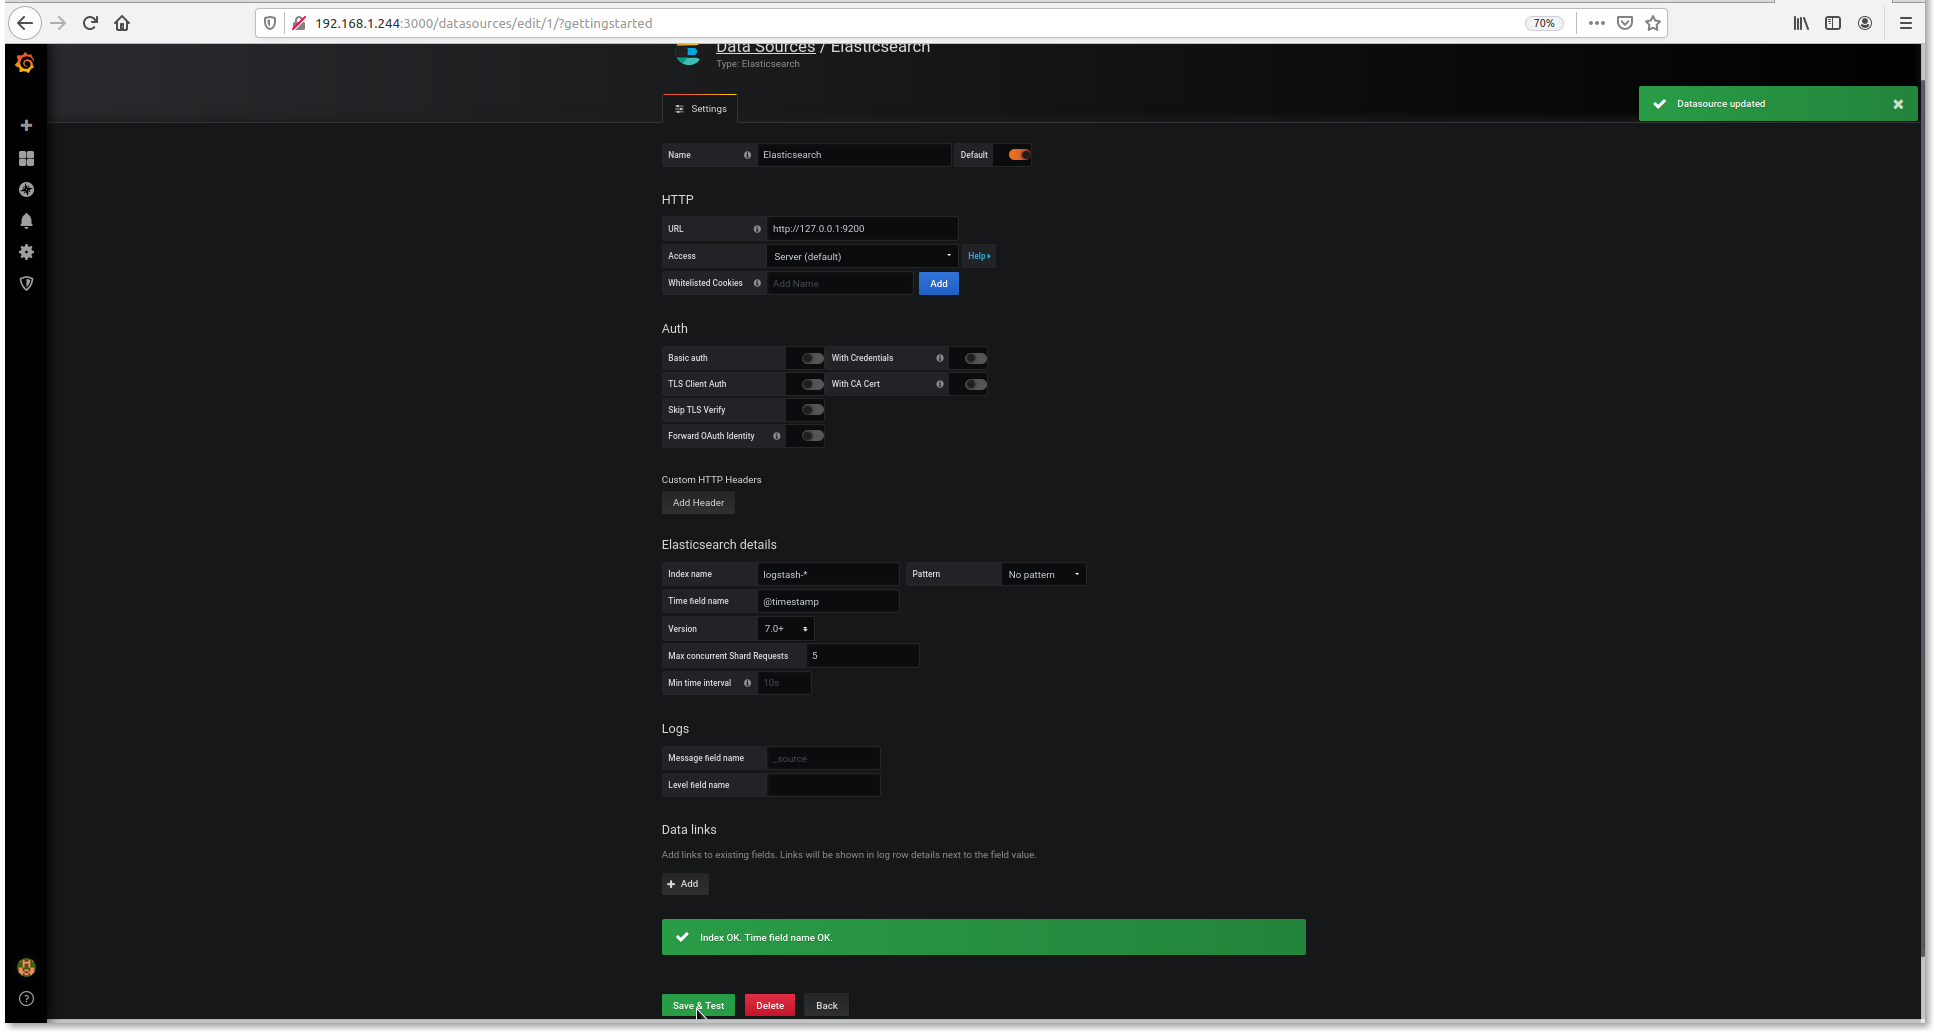
-
Set setting as below
    URL : http://127.0.0.1:9200
    Index name: logstash-*
    Time filed name: @timestamp
    Version: 7.0+
-
Click
New dashboard
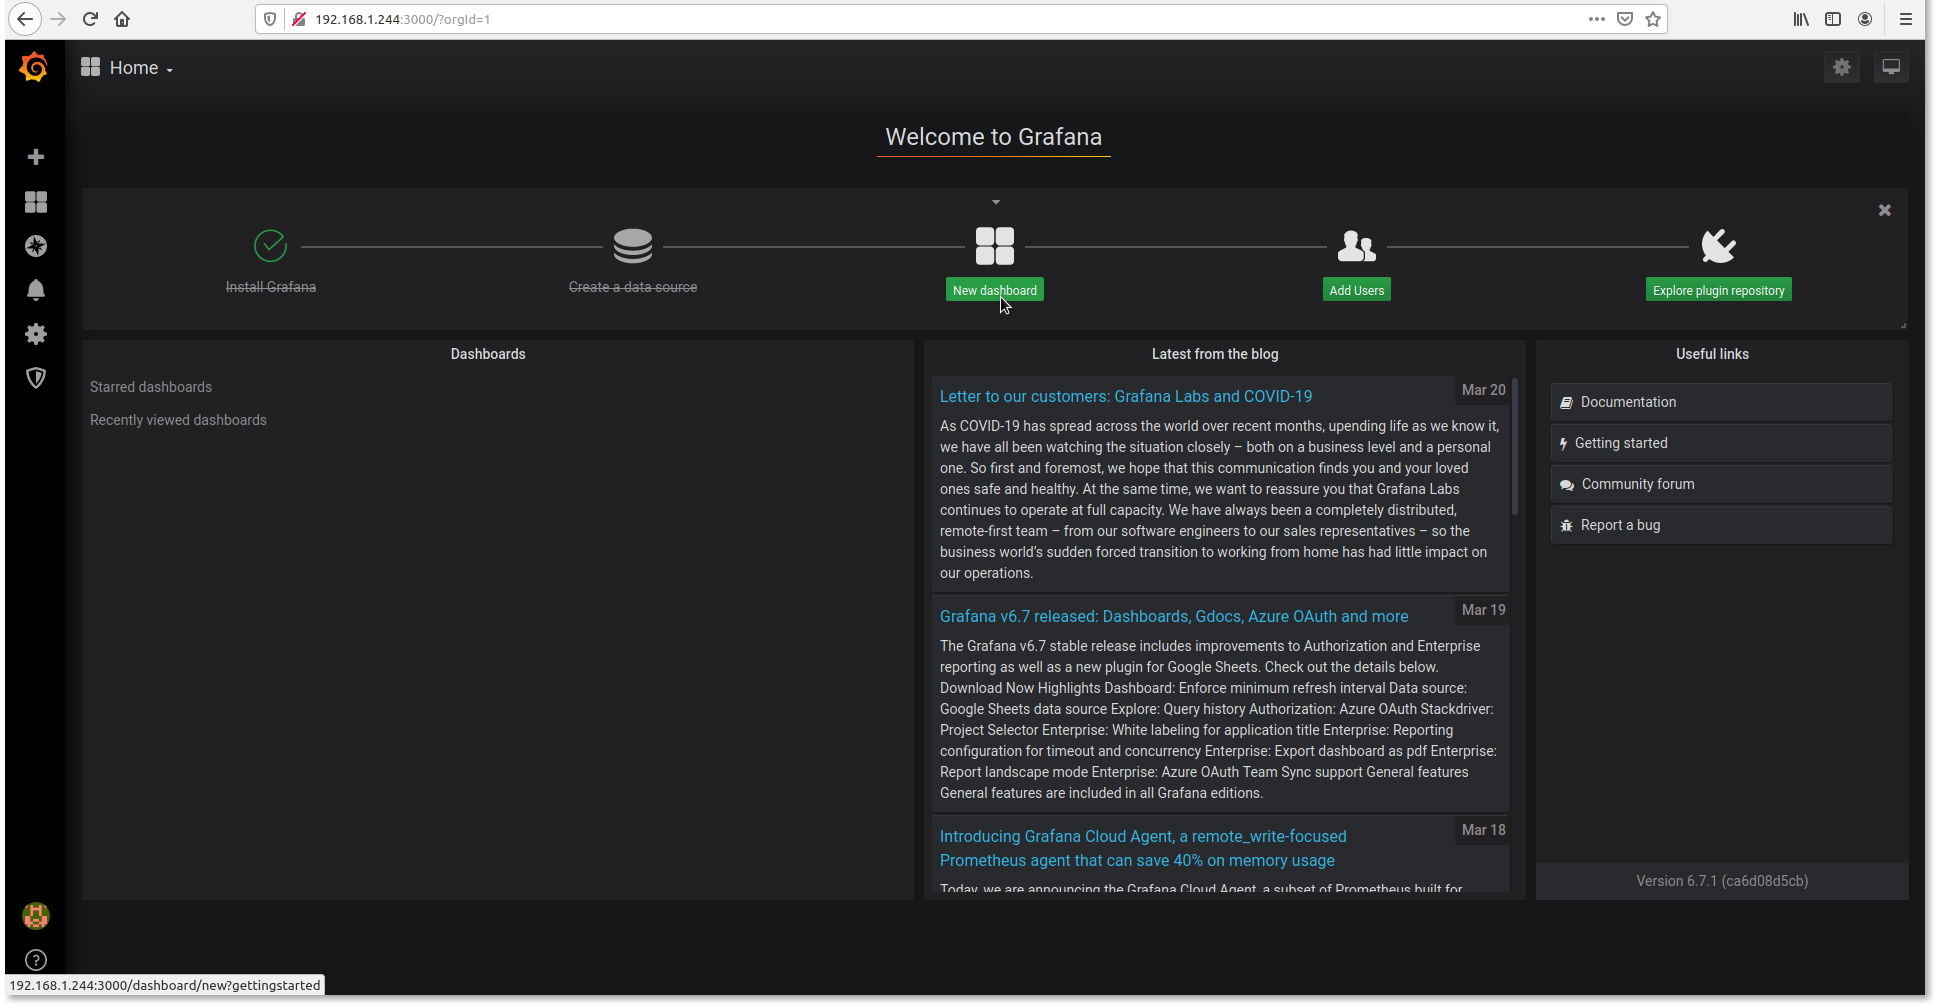
-
Click
Add Query
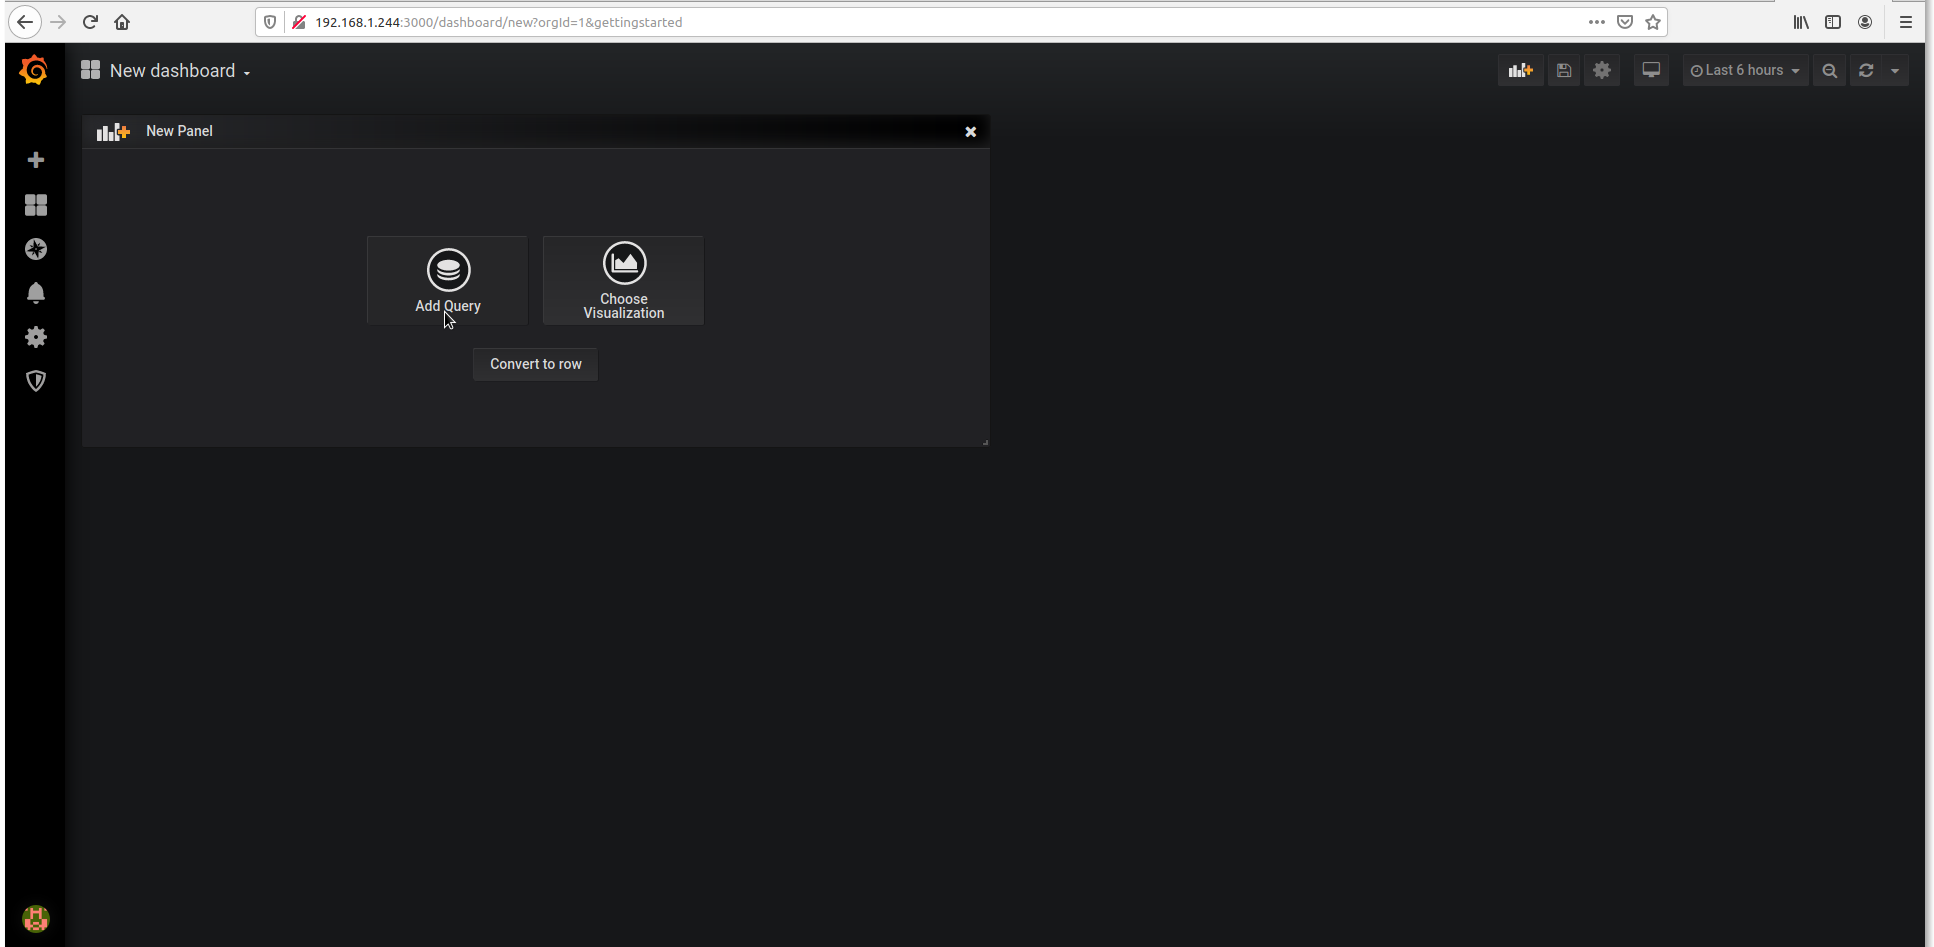
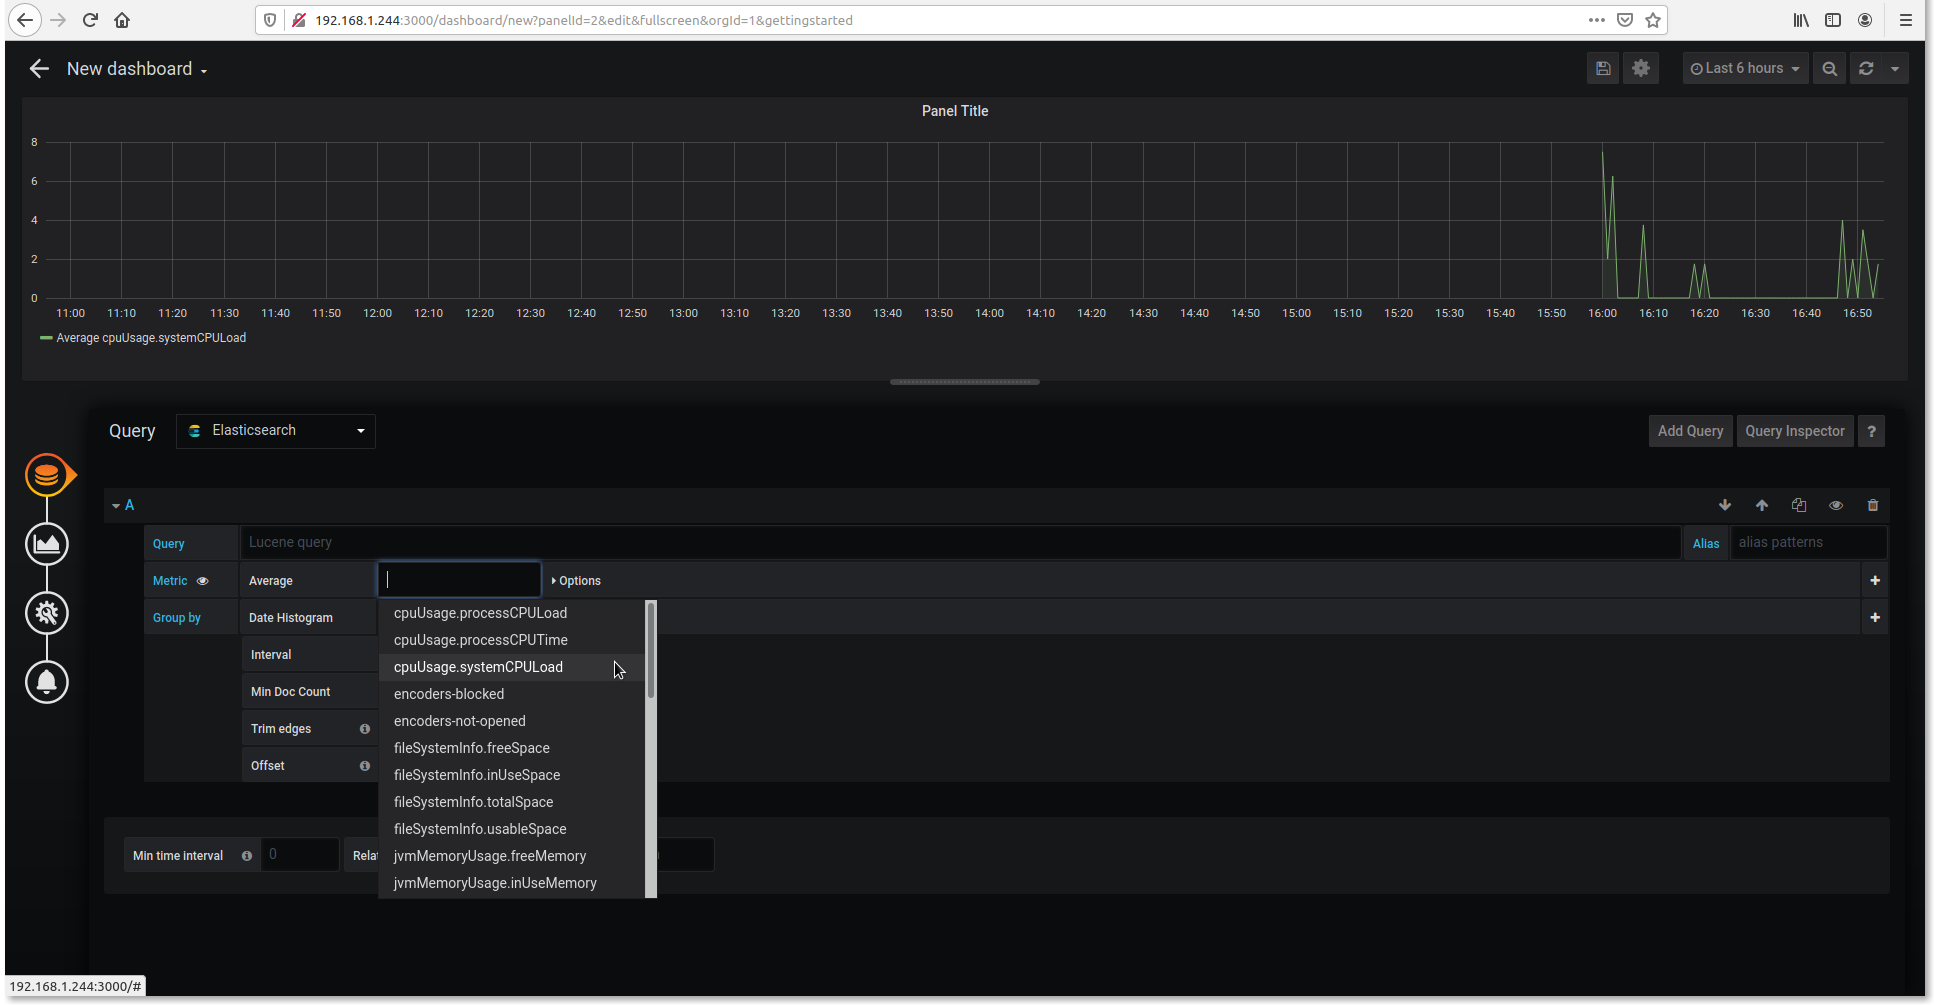
-
Choose whatever you want to monitor.
-
Ant Media Example Dashboard
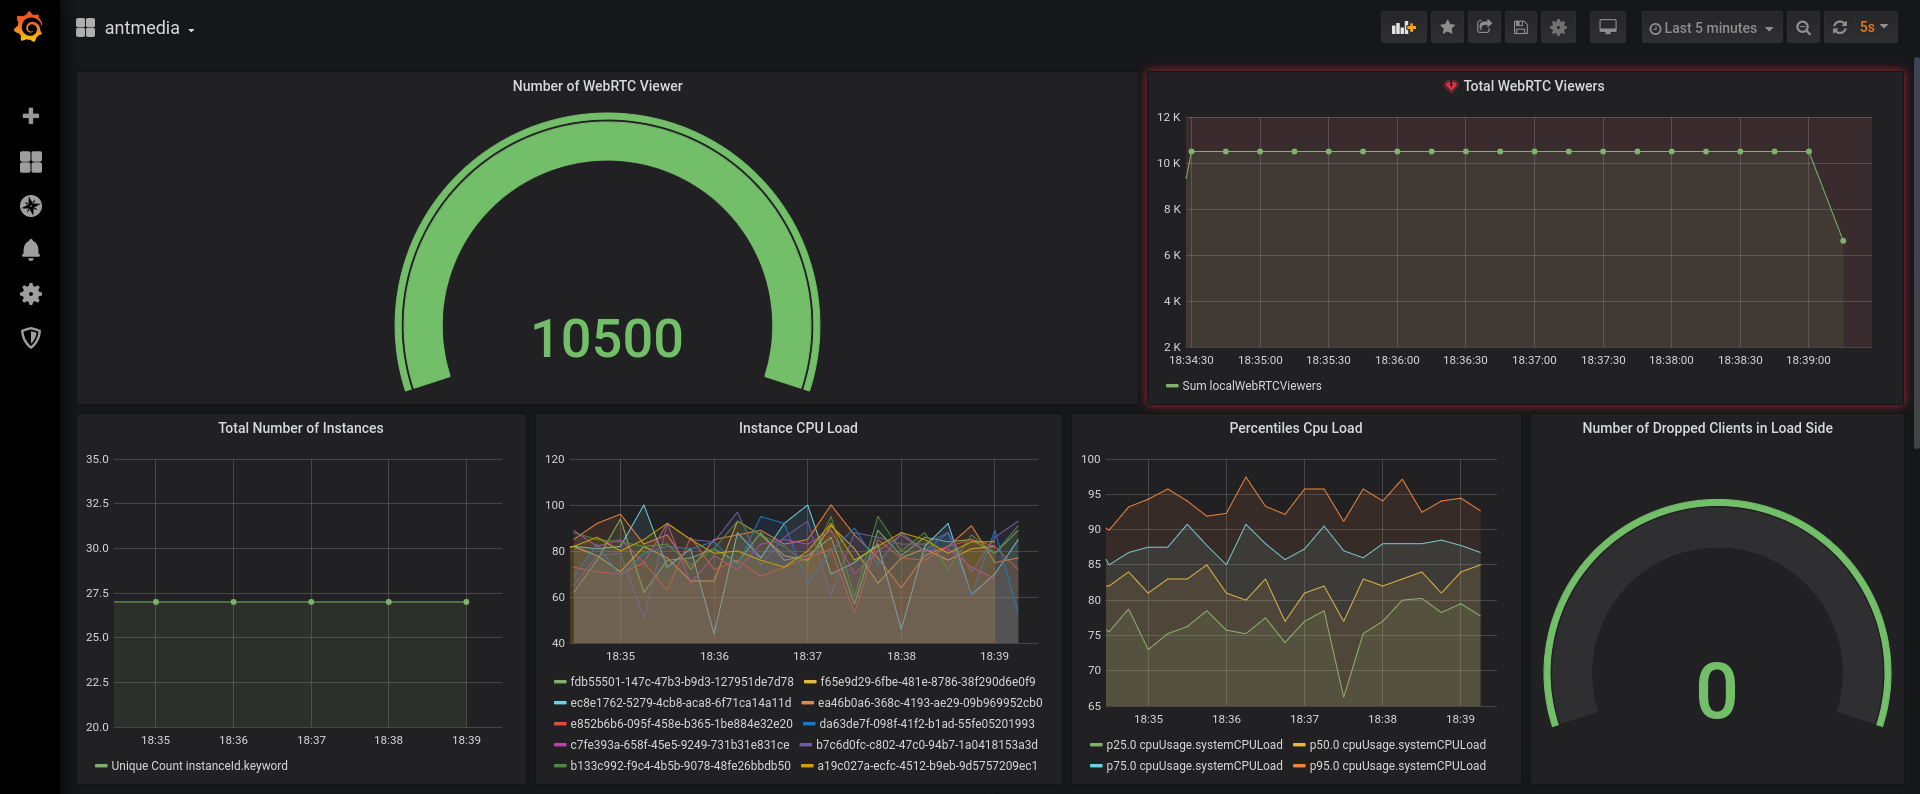
If you would like to use the same dashboard, you can download it from the below link https://antmedia.io/antmedia-dashboard.json
Create Telegram Alert
You can define an alert in Grafana and it can notify when specific events happen
- Create a New Bot
- Open Telegram and search for @BotFather user and send the following command:
/newbot - When you create a new bot, you will get response like below.
- Use this token to access the
HTTP API:1254341629:AAHYHhJK8TgsUXa7jqBK7wU1bJ8hzWhUFzs
Keep your token secure and store it safely, it can be used by anyone to control your bot.
- Create a Channel and retrieve the channel's chat ID.
- Create a channel in telegram and Invite your bot as an admin
- Send a test message and Get the Chat ID
- Use cURL or just visit the url below with your browser. Dont forget to replace the access token:
https://api.telegram.org/bot{USE_YOUR_ACCESS_TOKEN}/getUpdates
- You will get the lines like below.
    {"ok":true,"result":[{"update_id":222389875,
    "channel_post":{"message_id":2,"chat":
    {"id":-1001181377238,"title":"test","type":"channel"},"date":1587016720,"text":"test"}}]}
- Save the id number:
-1001181377238because we'll need it in next step
Configure Grafana Notification
We have configured the chatbot aboe. Now let's start to configure Grafana Notification.
-
Login to Grafana web panel via
http://your_grafana_server:3000 -
Click Alerting / Notification Channel
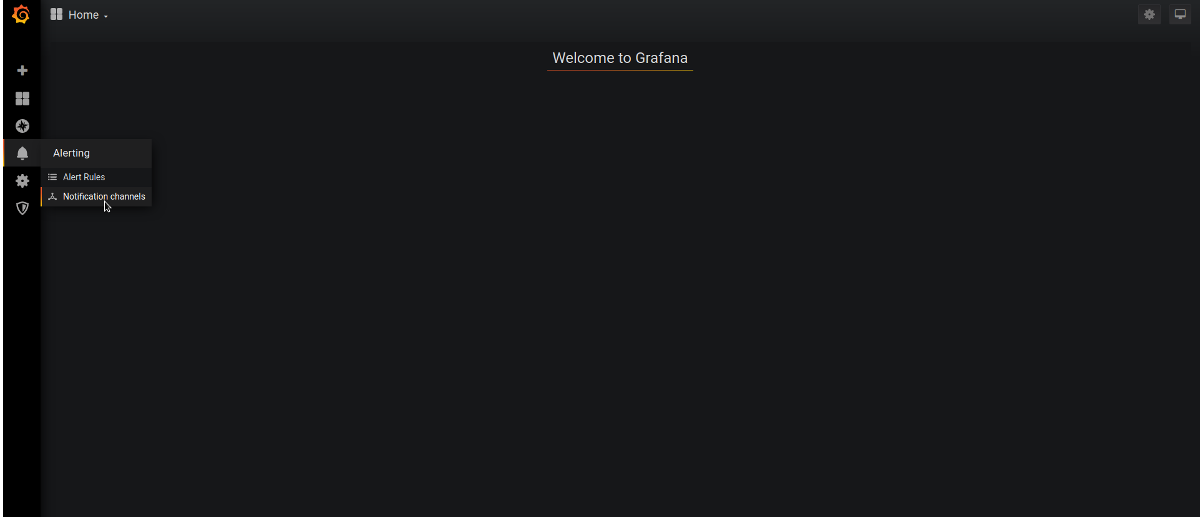
-
Add New Channel
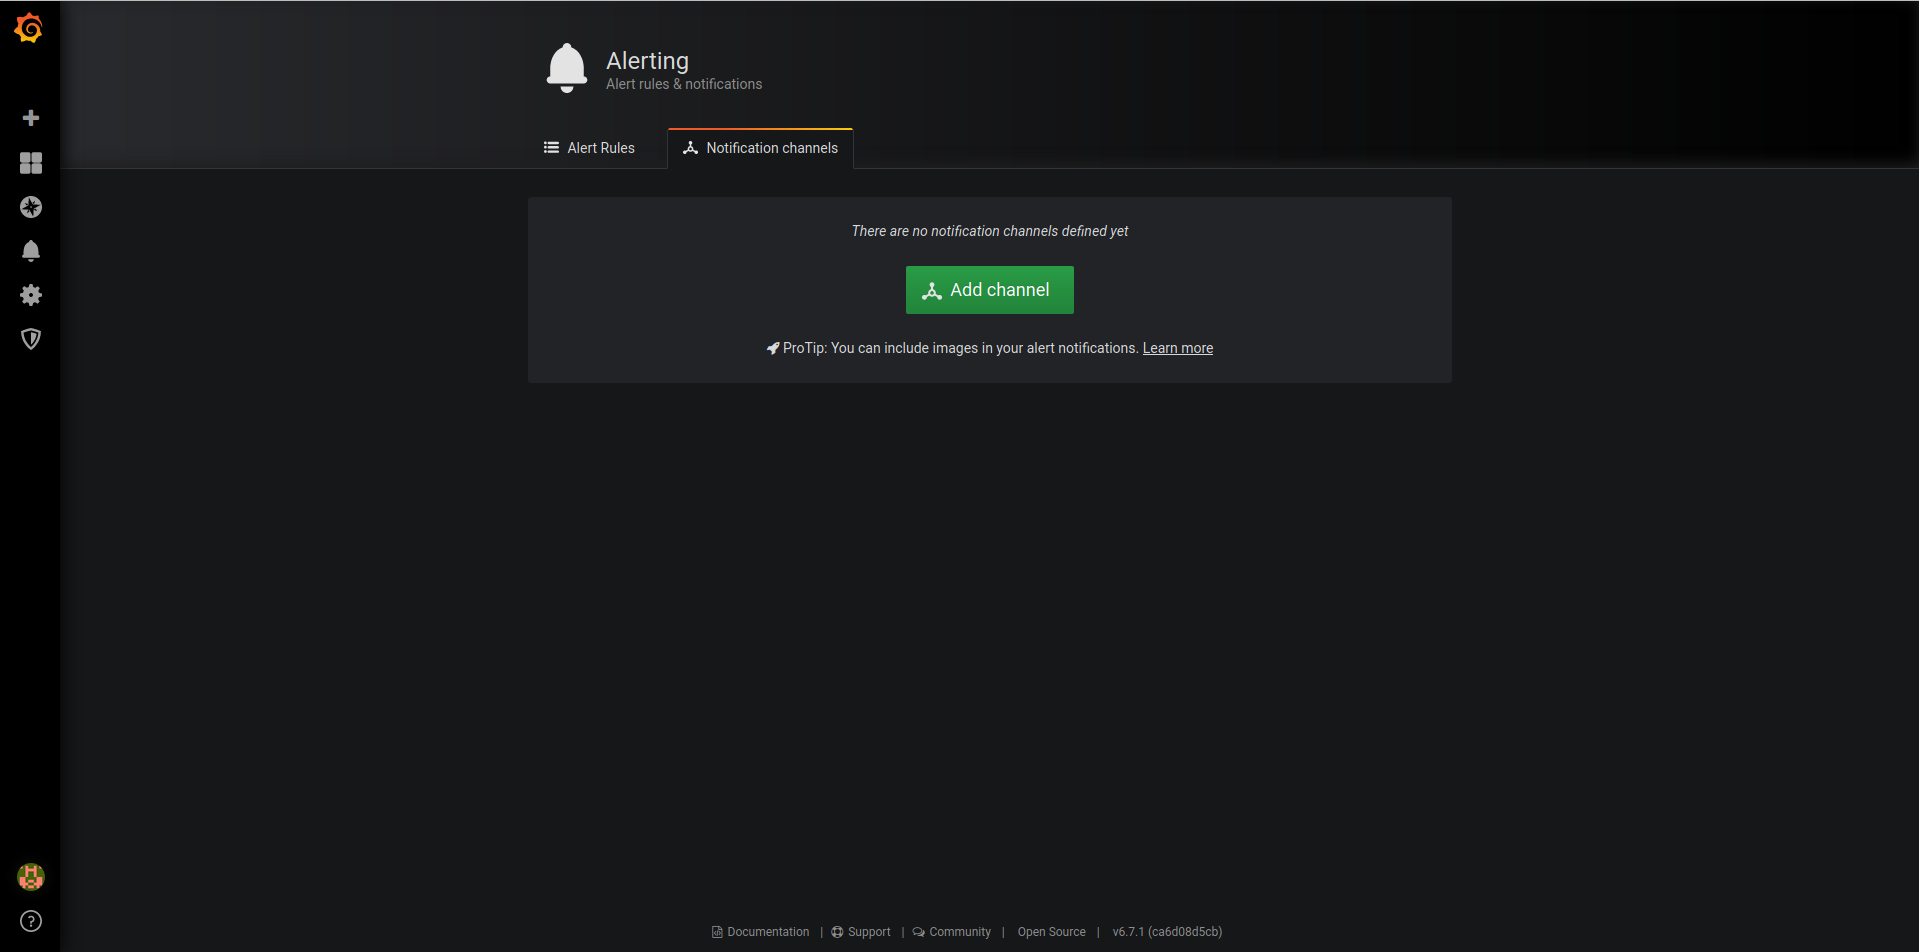
-
Configure it as shown in the below screenshot
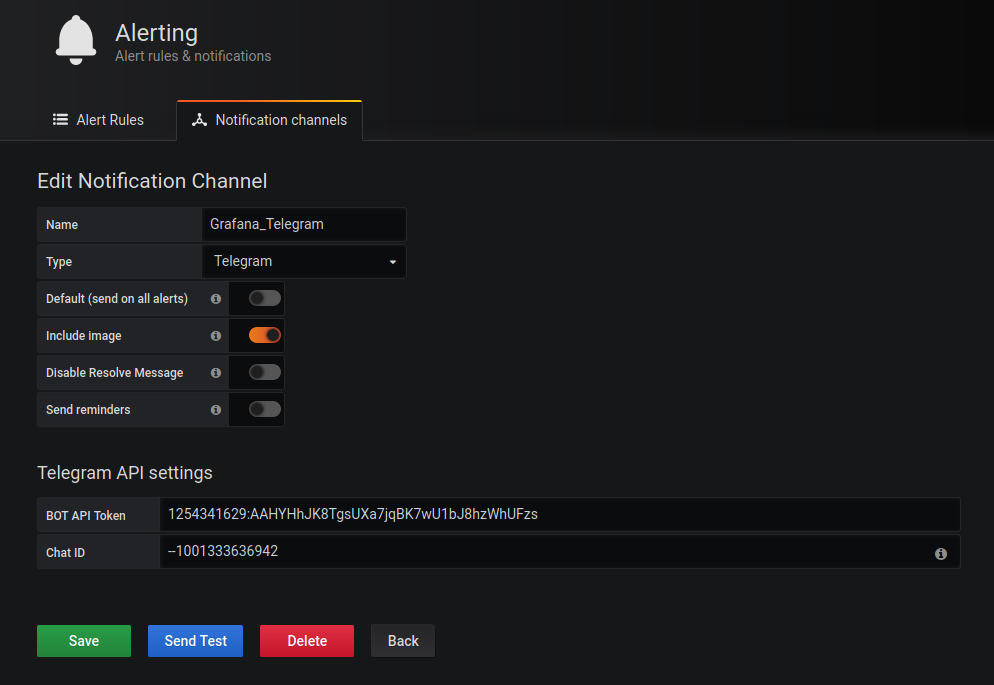
    Name : name_of_your_notification.
    Type : Telegram
    Bot Api Token: your_bot_token_id
    Chat ID: your_channel_id
- If you click on the Send Test and there is a message on the telegram, everything is fine.
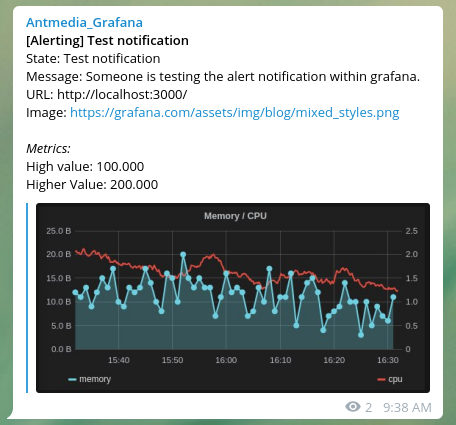
Now you've set up notifications as you wish.
How to Enable SSL
We prefer to use SSL termination.
- Run the following commands to install Nginx and certbot
    sudo apt install curl ca-certificates lsb-release -y
    echo "deb http://nginx.org/packages/`lsb_release -d | awk '{print $2}' | tr '[:upper:]' '[:lower:]'` `lsb_release -cs` nginx" | sudo tee /etc/apt/sources.list.d/nginx.list
- Now import an official Nginx signing key
curl -fsSL https://nginx.org/keys/nginx_signing.key | sudo apt-key add -
- Run the following commands to install nginx
    sudo apt update
    sudo apt install nginx certbot python3-certbot-nginx -y
- Run the following commands to create certificate
certbot --nginx -d yourdomain.com -d www.yourdomain.com
- edit crontab file with command
crontab -eand add below line to renew certificate each 80 days.
0 0 */80 * * root certbot -q renew --nginx
- Backup default Nginx configuration
mv /etc/nginx/conf.d/default.conf{,_bck}
- Create a new file called
grafana.confand edit and save the following lines according to you.
vim /etc/nginx/conf.d/grafana.conf
    server {
    	listen 443 ssl;
            server_name yourdomain.com;
    	ssl_certificate /etc/letsencrypt/live/yourdomain.com/fullchain.pem;
            ssl_certificate_key /etc/letsencrypt/live/yourdomain.com/privkey.pem;
            ssl_session_cache shared:le_nginx_SSL:1m;
    	ssl_session_timeout 1440m;
    	ssl_protocols TLSv1.2;
    	ssl_prefer_server_ciphers on;
    	ssl_ciphers "EECDH+ECDSA+AESGCM EECDH+aRSA+AESGCM EECDH+ECDSA+SHA384 EECDH+ECDSA+SHA256 EECDH+aRSA+SHA384 EECDH+aRSA+SHA256 EECDH+aRSA+RC4 EECDH EDH+aRSA HIGH !RC4 !aNULL !eNULL !LOW !3DES !MD5 !EXP !PSK !SRP !DSS";
           ssl_dhparam /etc/letsencrypt/ssl-dhparams.pem;
           add_header X-Frame-Options "SAMEORIGIN";
           add_header X-XSS-Protection "1; mode=block";
           location / {
                    proxy_set_header HOST $host;
                    proxy_set_header X-Forwarded-Proto $scheme;
                    proxy_set_header X-Real-IP $remote_addr;
                    proxy_set_header X-Forwarded-For $proxy_add_x_forwarded_for;
                    proxy_pass http://127.0.0.1:3000;
                }
    }
- You can reach Grafana through:
https://yourdomain.com/
Performance Tuning
The performance will be affected by system resources and network status.
- Heap size has to be less than 4Gb and not more than 8Gb. Set the minimum (Xms) and maximum (Xmx) heap allocation size to the same value to prevent the heap size from being resized.
For example, 4GB / 4GB is set for a total of 8Gb memory.
Open the following file then change Xms and Xmx values according to your total memory.
vim /etc/logstash/jvm.options
Xms4g Xmx4g
- The pipeline.workers setting determines how many threads to run for filter and output processing. This defaults to the number of the host's CPU cores.
Edit the logstash.yml file with command vim /etc/logstash/logstash.yml then change pipeline.workes according to your CPU cores. Example:
pipeline.workers: 4
- Ensure that the consumer_threads parameter matches the number of partitions that are specified in the Apache Kafka configuration. If you specify fewer partitions than consumer threads, some threads remain idle while they wait for an available partition.
/etc/logstash/conf.d/logstash.conf
    input {
      kafka {
        bootstrap_servers =>` "kafka_ip:9092"
        client_id =>` "logstash"
        group_id =>` "logstash"
        consumer_threads =>` 4
        ...
      }
    }
- You can find out how many partitions Kafka has by following the command below. And you can equate the number of consumer threads to the number of partitions.
./kafka-topics.sh --describe --zookeeper 127.0.0.1:2181 --topic ams-instance-stats
- If you want to increase the partition number in Kafka, you can use the following command.
./kafka-topics.sh --zookeeper 127.0.0.1:2181 --alter --topic ams-instance-stats --partitions 4
- Comment the setting for syslog logging
stdout { codec => rubydebug }from/etc/logstash/conf.d/logstash.conffile.
    input {
      kafka {
        bootstrap_servers =>` "kafka_ip:9092"
        client_id =>` "logstash"
        group_id =>` "logstash"
        consumer_threads =>` 4
        topics =>` ["ams"]
        codec =>` "json"
        tags =>` ["log", "kafka_source"]
        type =>` "log"
      }
    }

    #elasticsearch
    output {
      elasticsearch {
         hosts =>` ["127.0.0.1:9200"] #elasticsearch_ip
         index =>` "logstash-%{[type]}-%{+YYYY.MM.dd}"
      }
    #  stdout { codec =>` rubydebug }
    }
- Finally, restart logstash and kafka service.
systemctl restart logstash && systemctl restart kafka
This is the whole setup of monitoring Ant Media Servers. If you have any questions, please just drop a line to contact@antmedia.io