Before starting the blog post, I just want to thank you all people in the community that makes Ant Media Server Instances run in 120 countries.
So we listen our users and one of the common question we receive is how to Monitor Ant Media Server instances. It’s really a crucial thing when you have lots of instances running for your media streaming service. So we’ve implemented some monitoring methods to make monitoring Ant Media Server instances easy and adaptable for any system.
How It Works
For Ant Media Server side, it’s just an event producer for Apache Kafka. Ant Media Server sends instance and stream stats to Apache Kafka for every 15 seconds. You can consume Apache Kafka events with any other tool or pipeline. For our case, we used the pipeline below for collecting and visualization of the stats.
1. Ant Media Server sends events to Apache Kafka
2. Logstash consumes Apache Kafka Events and writes them to Elastic Search
3. Grafana collects the stats from Elastic Search and visualize them.
So in this blog post, we show up how to install the pipeline above to have a turnkey monitoring solution for Ant Media Server Instances.
Let’s get started by installing the components below:
Install Apache Kafka
Apache Kafka is useful for building real-time streaming data pipelines to get data between the systems or applications.
- Install Java because Apache Kafka requires Java.
apt-get update && apt-get install openjdk-8-jdk -y - Download the Apache Kafka and then extract the archive file
wget -qO- https://archive.apache.org/dist/kafka/2.2.0/kafka_2.12-2.2.0.tgz | tar -zxvf- -C /opt/ && mv /opt/kafka* /opt/kafka - Edit server.properties
vim /opt/kafka/config/server.propertiesfile as below.listeners=PLAINTEXT://your_server_ip:9092 - Start Apache Kafka
/opt/kafka/bin/zookeeper-server-start.sh /opt/kafka/config/zookeeper.properties &
/opt/kafka/bin/kafka-server-start.sh /opt/kafka/config/server.properties &
Firstly, we’ve started ZooKeeper because Kafka needs ZooKeeper and then we’ve started Kafka.
- Check if it’s working by running the command below
netstat -tpln | egrep "9092|2181"if you see that the ports(9092 and 2181) are in listening mode, it means yeah it’s working. You’ve finished the first installation.
Run Apache Kafka as a systemd Service.
Running Apache Kafka as a systemd service will let us manage Apache Kafka services with systemctl commands. Follow the instructions below:
- Create
systemdunit file for Apache Kafkavim /lib/systemd/system/kafka.service - Copy and paste the below content into the
kafka.serviceyou’ve created above. Make sure that you set the correct JAVA_HOME path for your system in the content below[Unit] Description=Apache Kafka Server Requires=network.target remote-fs.target After=network.target remote-fs.target kafka-zookeeper.service [Service] Type=simple Environment=JAVA_HOME=/usr/lib/jvm/java-1.8.0-openjdk-amd64 ExecStart=/opt/kafka/bin/kafka-server-start.sh /opt/kafka/config/server.properties ExecStop=/opt/kafka/bin/kafka-server-stop.sh [Install] WantedBy=multi-user.target - Create
systemdunit file for Zookeepervim /lib/systemd/system/kafka-zookeeper.service - Copy and paste the below content to the
kafka-zookeeper.servicefile you’ve created above.[Unit] Description=Apache Zookeeper Server Requires=network.target remote-fs.target After=network.target remote-fs.target [Service] Type=simple Environment=JAVA_HOME=/usr/lib/jvm/java-1.8.0-openjdk-amd64 ExecStart=/opt/kafka/bin/zookeeper-server-start.sh /opt/kafka/config/zookeeper.properties ExecStop=/opt/kafka/bin/zookeeper-server-stop.sh [Install] WantedBy=multi-user.target - Enable and reload the systemd daemon to apply new changes.
systemctl enable kafka-zookeeper.service systemctl enable kafka.service - Start Apache Kafka with systemctl
systemctl start kafka-zookeeper.service
systemctl start kafka.service
Kafka Settings for Ant Media Server
If you want to monitor Ant Media Server, you need to set the IP address of your Apache Kafka in AMS_INSTALLTION_DIR/conf/red5.properties file.
- Open the following line with the editor
vim /usr/local/antmedia/conf/red5.properties - Edit the following line
server.kafka_brokers=ip_address:port_numberReplaceip_address:port_numberwith Apache Kafka IP Address and port number. Example:server.kafka_brokers=192.168.1.230:9092 - Restart Ant Media Server:
service antmedia restart - Check if it’s working. When you run the following command on Kafka server, if there is data flow, this means everything is configured properly.
/opt/kafka/bin/kafka-console-consumer.sh --bootstrap-server 192.168.1.230:9092 --topic ams-instance-stats --from-beginningOutput should be something like below:{"instanceId":"a06e5437-40ee-49c1-8e38-273544964335","cpuUsage": {"processCPUTime":596700000,"systemCPULoad":0,"processCPULoad":1},"jvmMemoryUsage": {"maxMemory":260046848,"totalMemory":142606336,"freeMemory":21698648,"inUseMemory":120907688},"systemInfo": {"osName":"Linux","osArch":"amd64","javaVersion":"1.8","processorCount":1},"systemMemoryInfo": ...
Some Useful Apache Kafka Commands
- List all topics
/opt/kafka/bin/kafka-topics.sh --list --bootstrap-server your_kafka_server:9092Example:/opt/kafka/bin/kafka-topics.sh --list --bootstrap-server 192.168.1.230:9092 ams-instance-stats ams-webrtc-stats kafka-webrtc-tester-stats - Monitor messages for a specific topic with Kafka Consumer as we’ve used above
/opt/kafka/bin/kafka-console-consumer.sh --bootstrap-server 192.168.1.230:9092 --topic ams-instance-stats --from-beginning
Install Elasticsearch and Logstash
Install Elasticsearch
- Import GPG key and Repo
wget -qO - https://artifacts.elastic.co/GPG-KEY-elasticsearch | sudo apt-key add - sudo apt-get install apt-transport-https echo "deb https://artifacts.elastic.co/packages/7.x/apt stable main" | sudo tee -a /etc/apt/sources.list.d/elastic-7.x.list - Update package lists and install elastic search
apt-get update && apt-get install elasticsearch - Enable and start elasticsearch service
systemctl enable elasticsearch.service
systemctl start elasticsearch.service
Install Logstash
Logstash is a server‑side data processing pipeline that ingests data from multiple sources simultaneously, transforms it and then sends it to a “stash” like Elasticsearch
- Update your package lists, then install
logstashwith the following commandapt-get update && apt-get install logstash - Enable logstash service
systemctl enable logstash.service - Configure logstash. Create /etc/logstash/conf.d/logstash.conf file and add below content. Please don’t forget to replace
kafka_server_ipand make sureelasticsearch_ipis correct.#kafka input { kafka { bootstrap_servers => "kafka_server_ip:9092" client_id => "logstash" group_id => "logstash" consumer_threads => 3 topics => ["ams-instance-stats","ams-webrtc-stats","kafka-webrtc-tester-stats"] codec => "json" tags => ["log", "kafka_source"] type => "log" } } #elasticsearch output { elasticsearch { hosts => ["127.0.0.1:9200"] #elasticsearch_ip index => "logstash-%{[type]}-%{+YYYY.MM.dd}" } stdout { codec => rubydebug } } - Save and close the file, then restart
logstashservicesystemctl restart logstash
Test Elasticsearch and Logstash Configuration
You can test that Elasticsearch and Logstash are working correctly with the command below.
curl -XGET 'localhost:9200/_cat/indices?v&pretty'
Example output:
health status index                   uuid                   pri rep docs.count docs.deleted store.size pri.store.size

yellow open   logstash-log-2020.03.23 mf-ffIHBSNO4s7_YoUr_Rw   1   1       1300            0    527.5kb        527.5kb
Install Grafana
Grafana is an open source metric analytics & visualization suite.
- In order to install Grafana Server, run the following commands.
sudo apt-get install -y software-properties-common wget apt-transport-https wget -q -O - https://packages.grafana.com/gpg.key | sudo apt-key add - sudo add-apt-repository "deb https://packages.grafana.com/oss/deb stable main" sudo apt-get update && sudo apt-get install grafana - Enable and start grafana server
systemctl enable grafana-server
systemctl start grafana-server
Configure Grafana
- Login to Web panel(
http://your_ip_address:3000/login) through your web browser. Default username and password isadmin/admin - Click
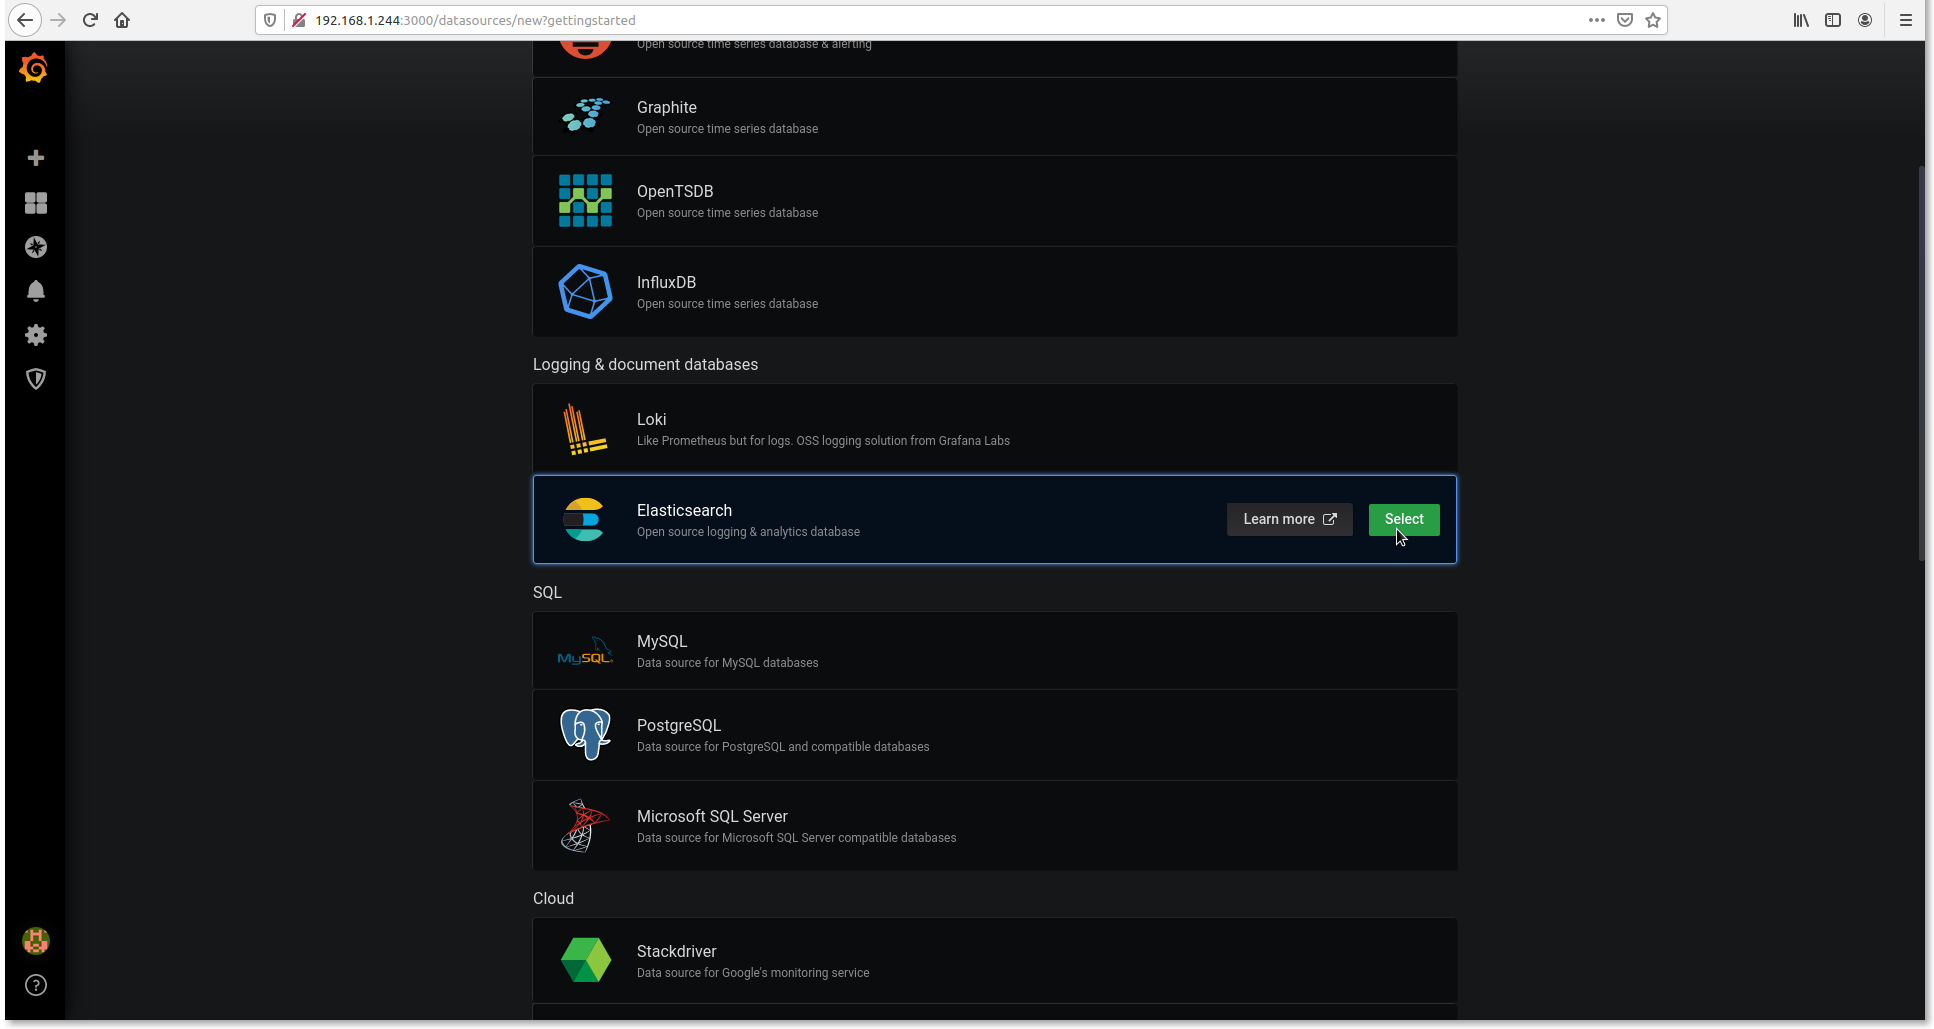
Add data source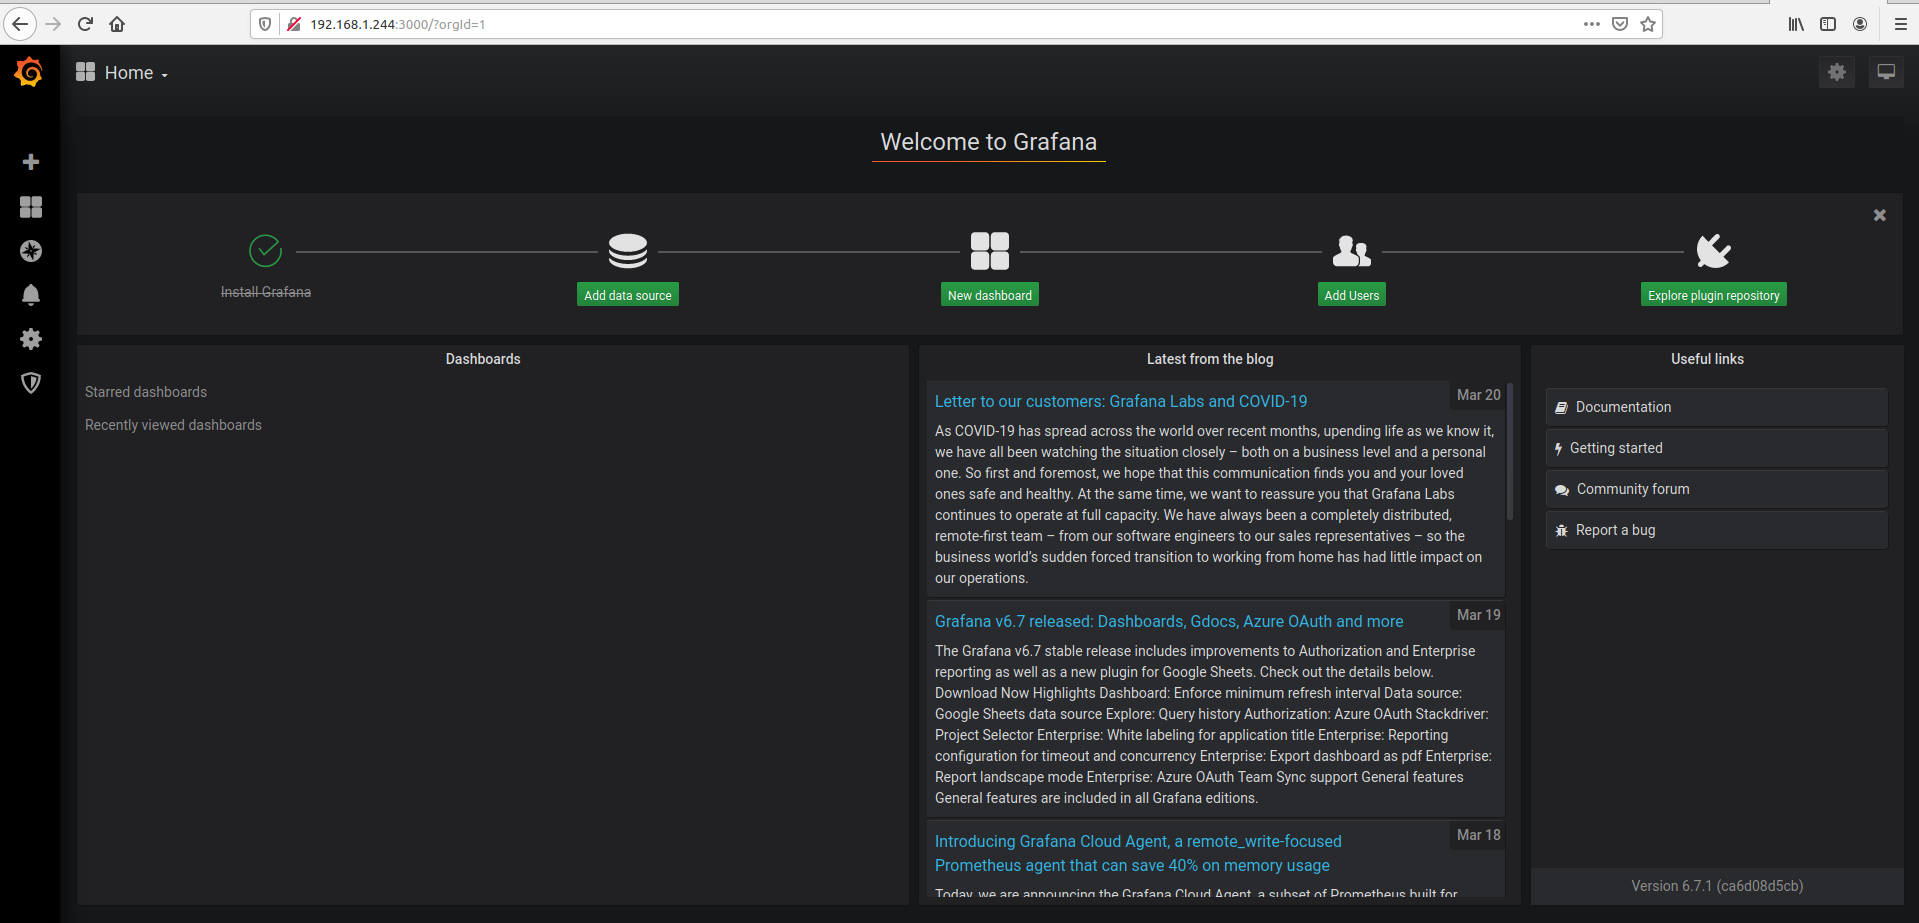
- Select Elasticsearch
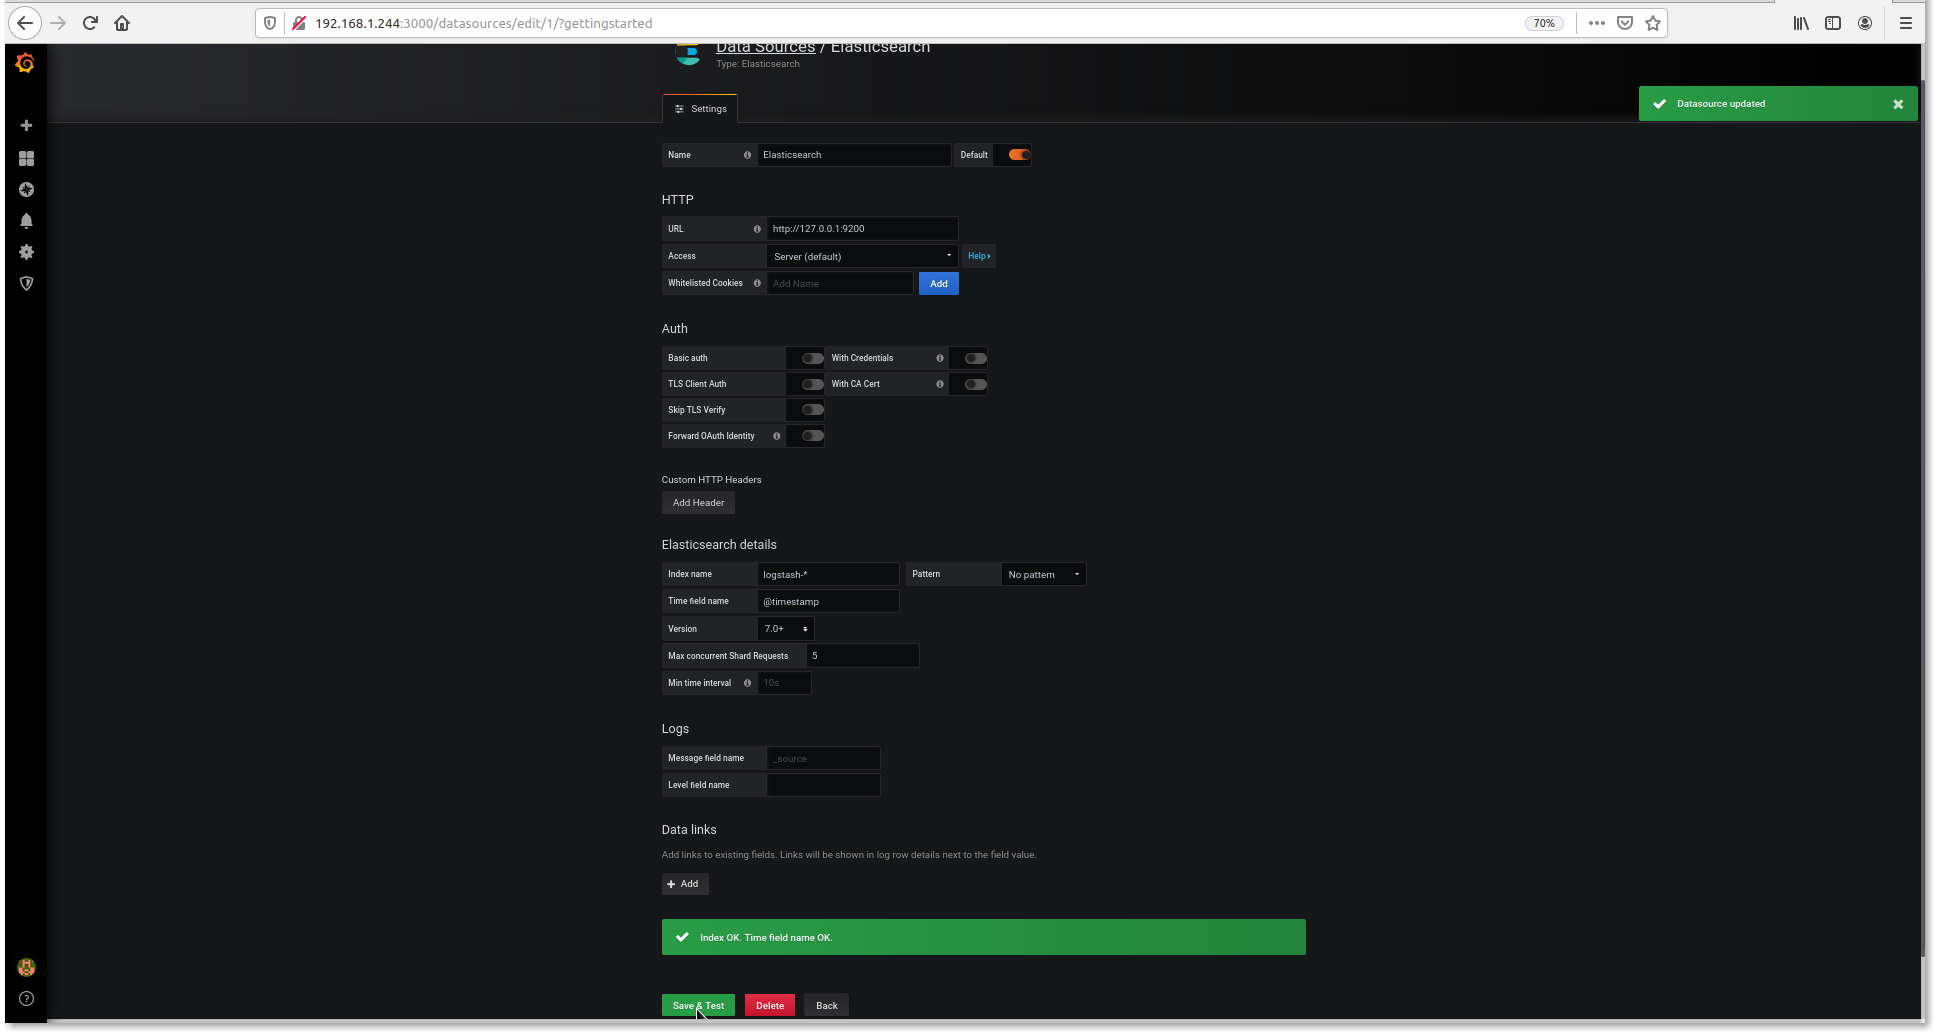
- Set setting as below
URL : http://127.0.0.1:9200
Index name: logstash-
Time filed name: @timestamp
Version: 7.0+
- Click
New dashboard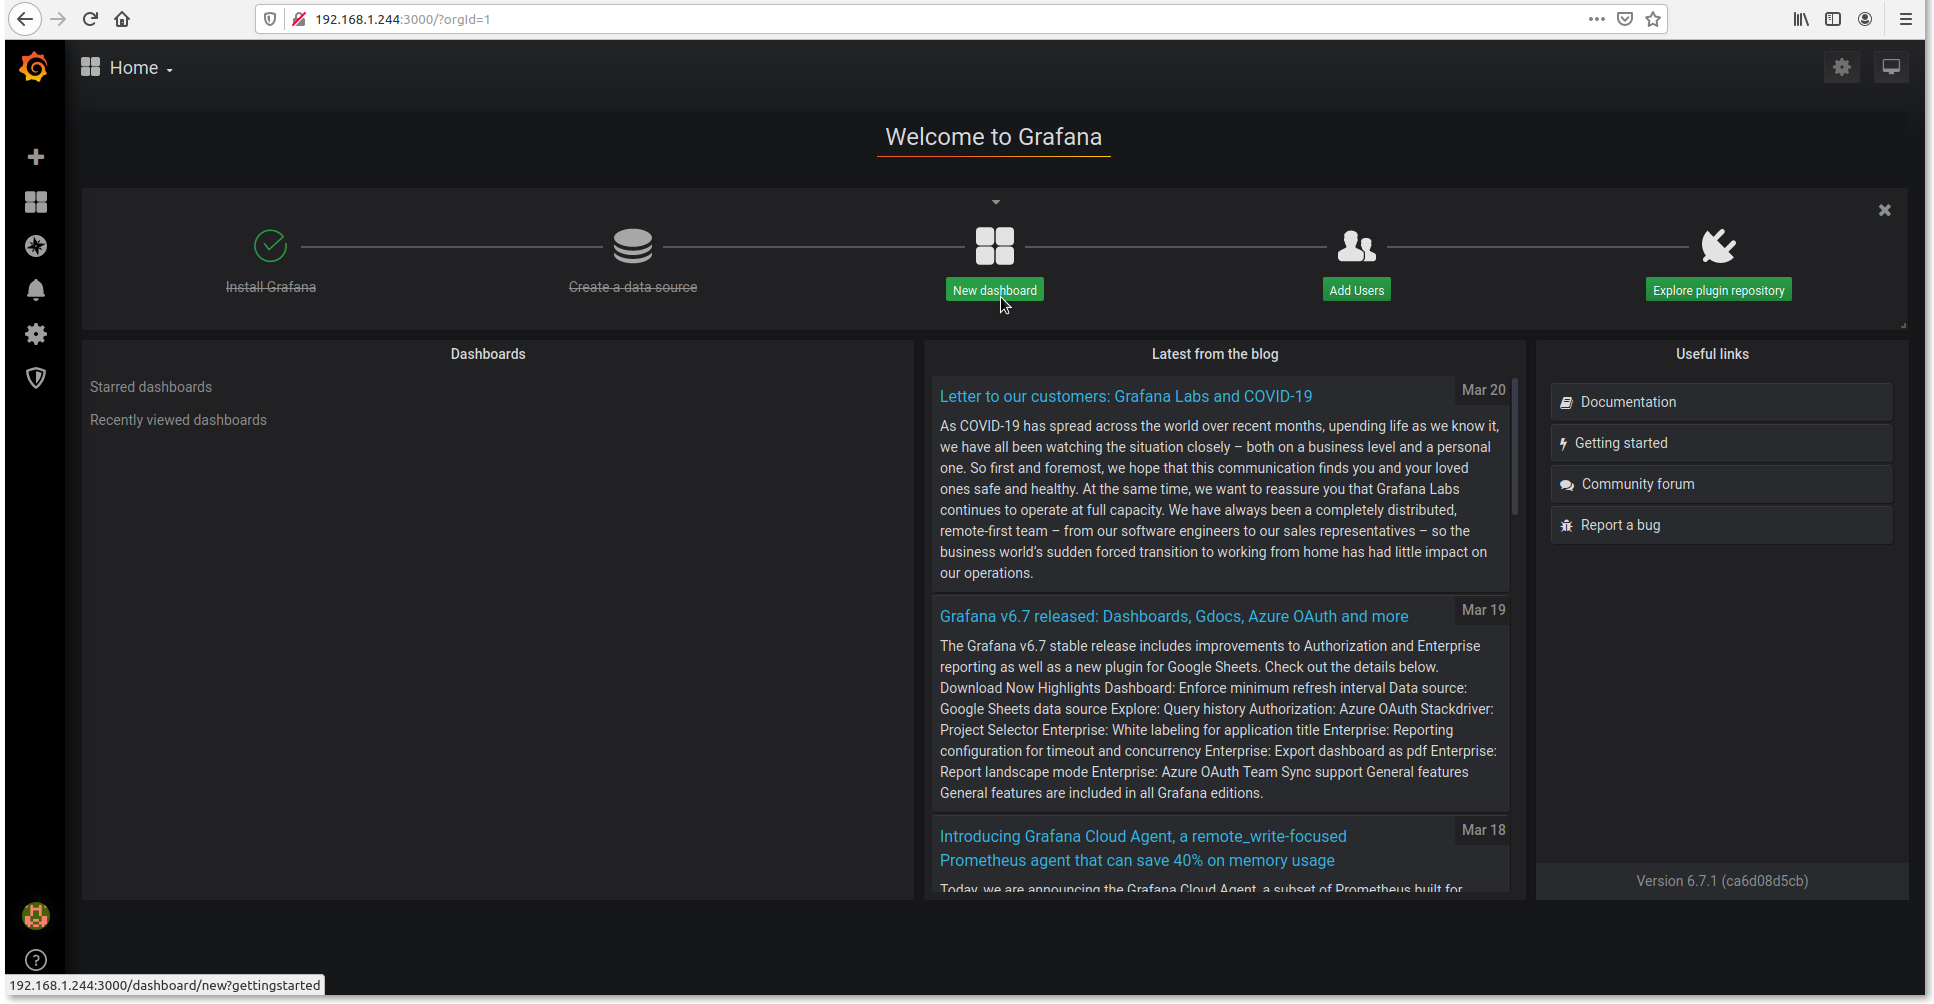
- Click
Add Query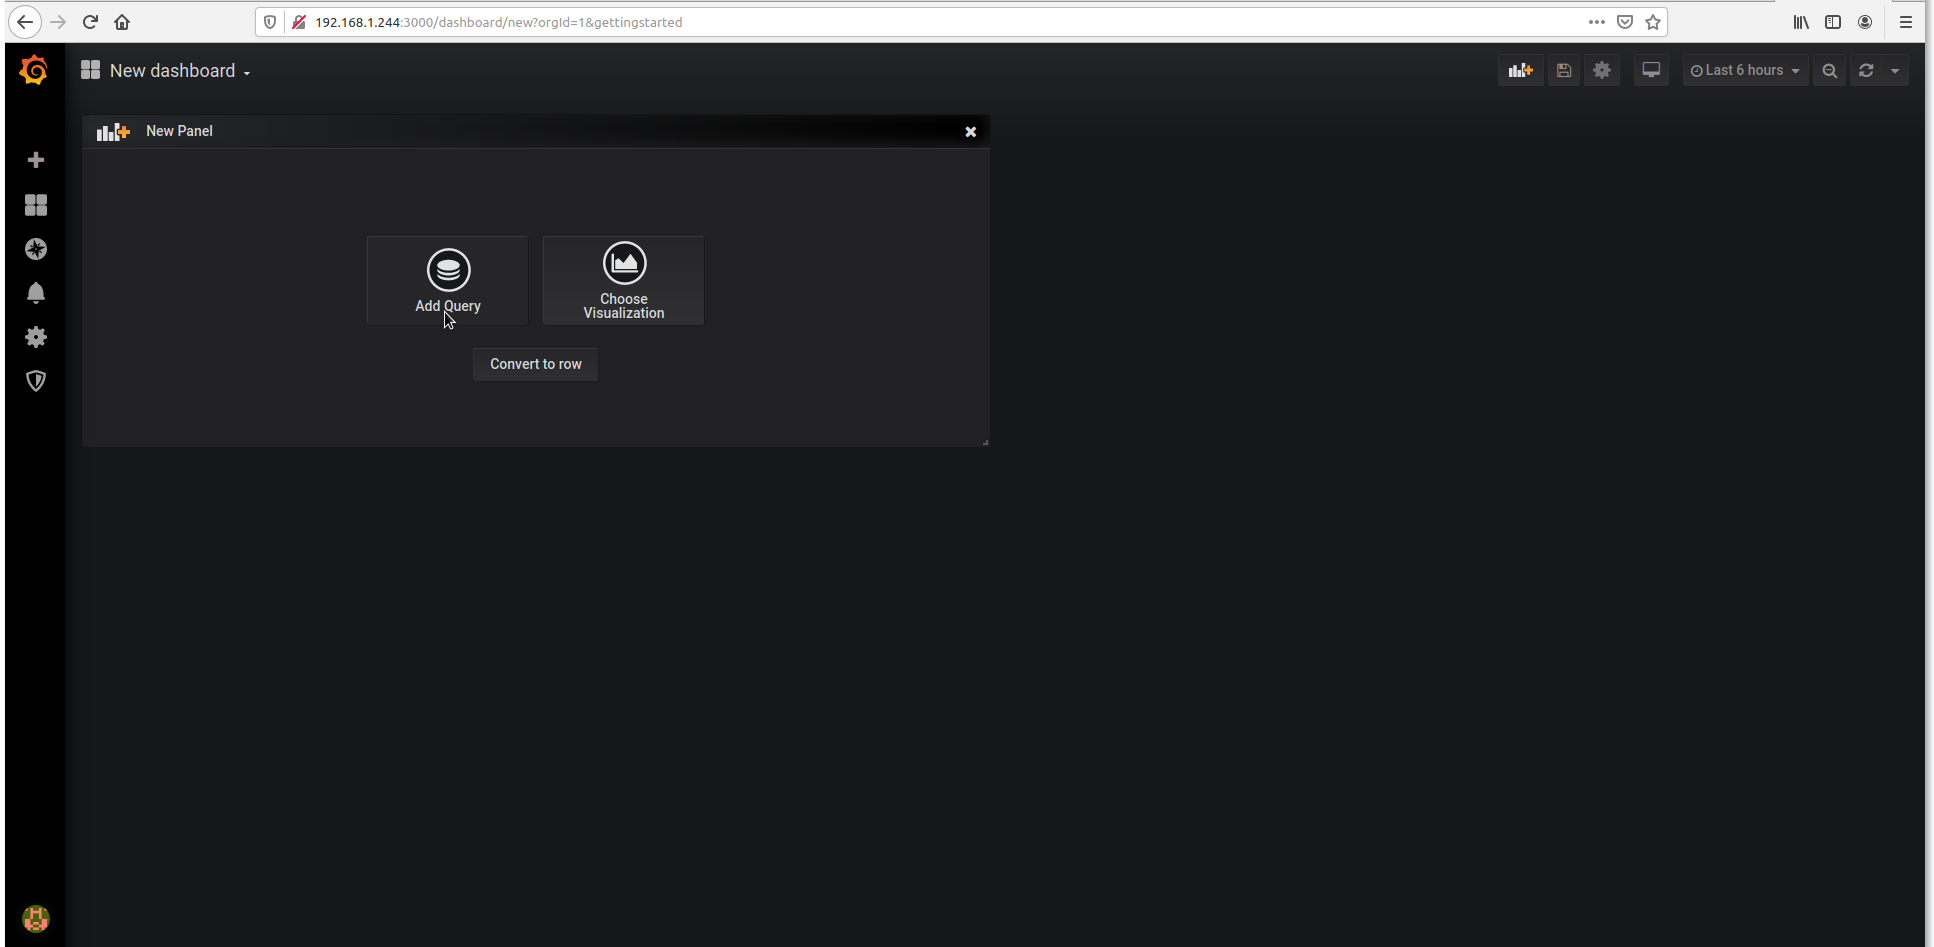
- Choose whatever you want to monitor.
Query: ElasticSearch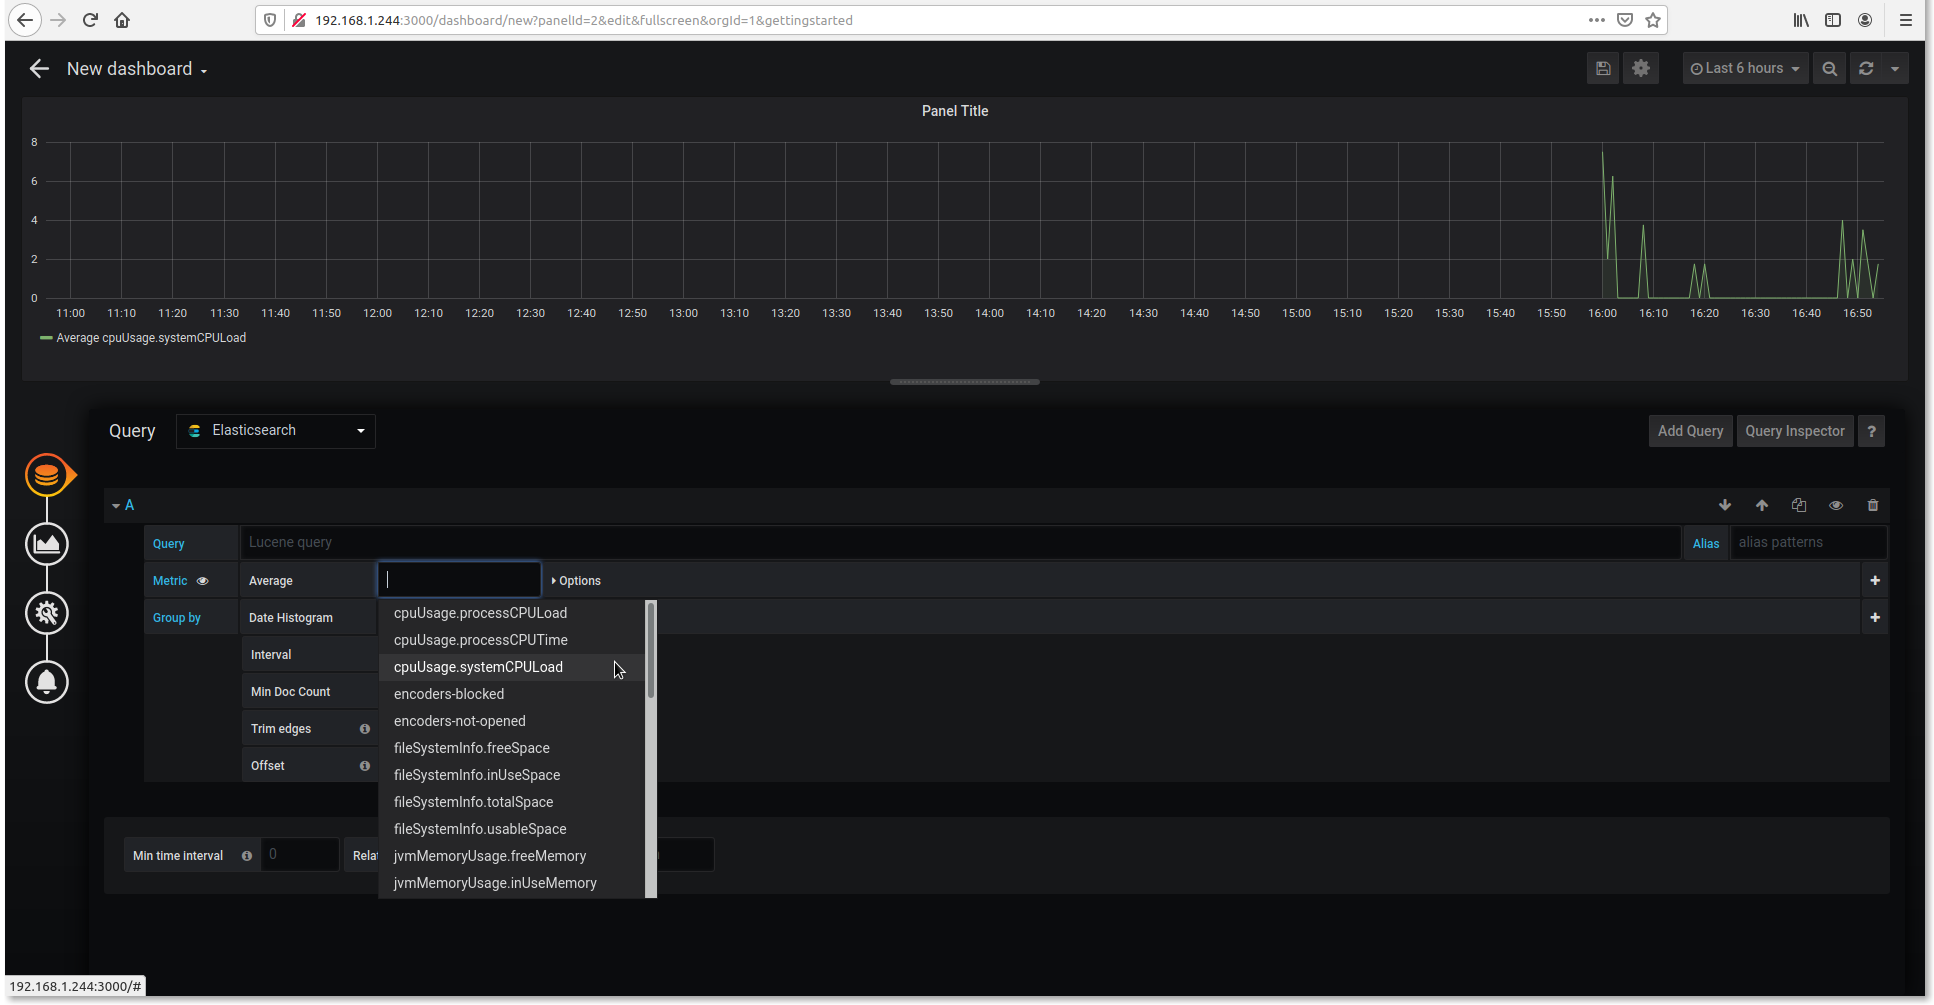
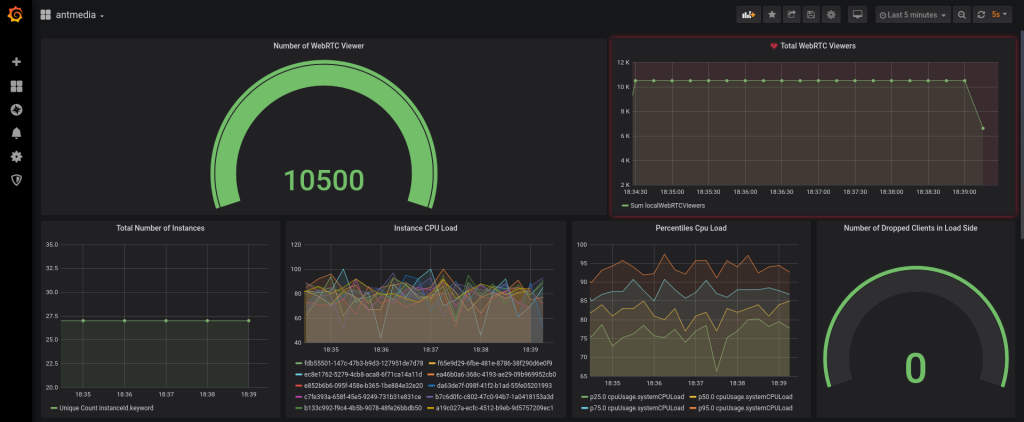
- Ant Media Example Dashboard
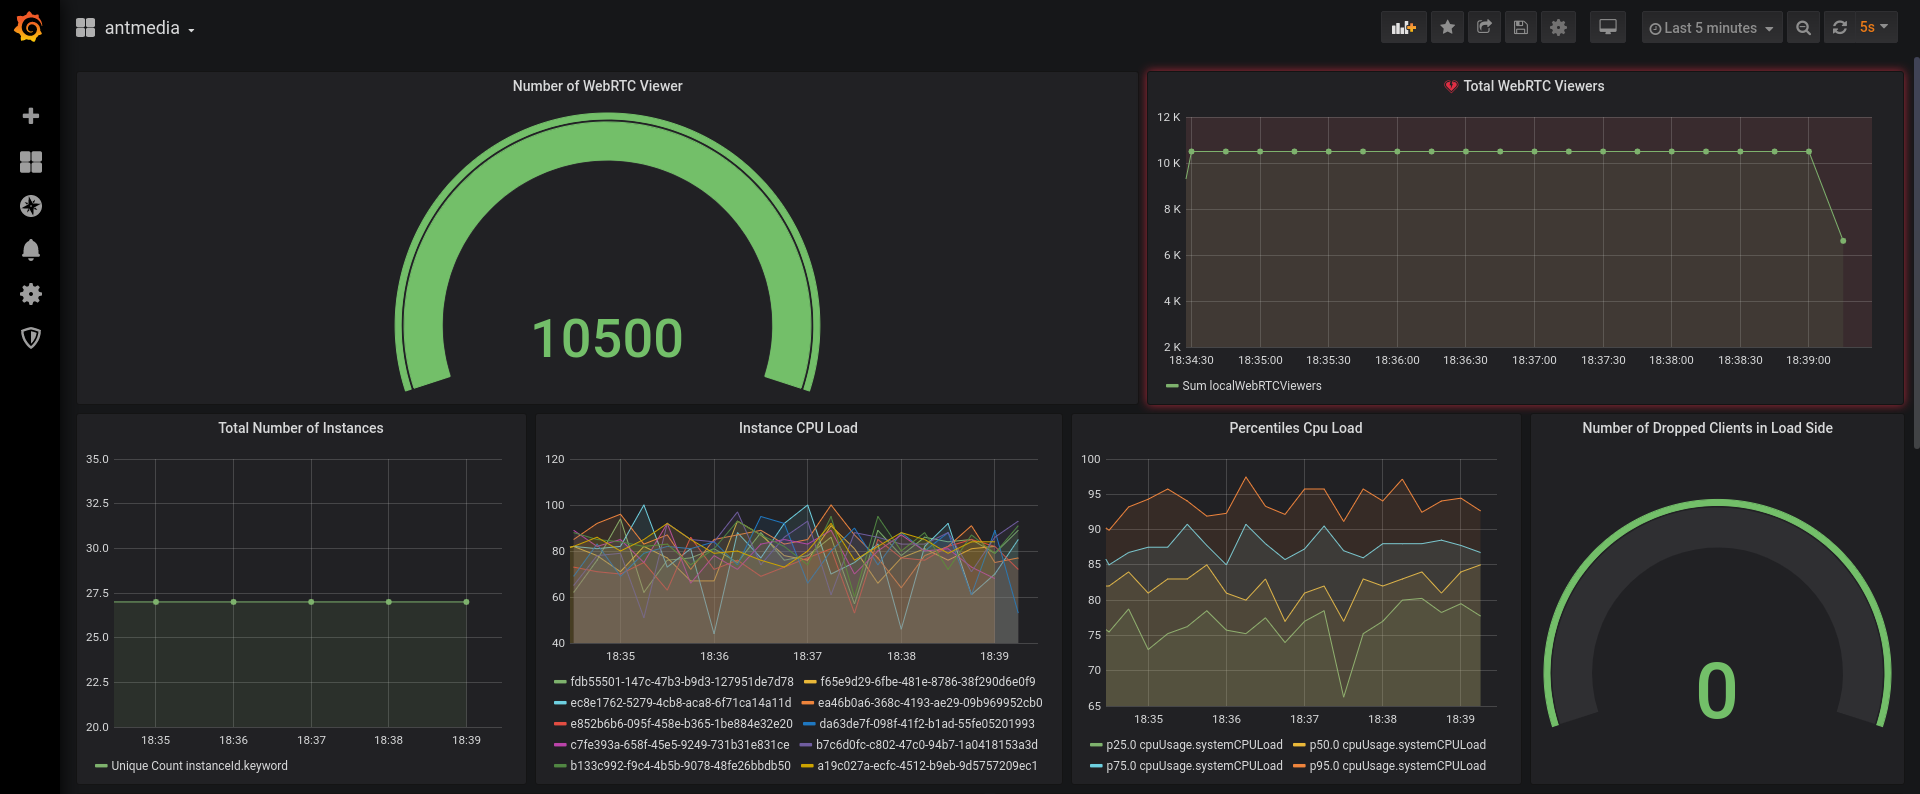
If you would like to use the same dashboard, you can download it from the below link.
Bonus: Create Telegram Alert
You can define an alert in Grafana and it can notify you when specific events happen
- Create a New Bot
- Open Telegram and search for @BotFather user and send the following command.
/newbot - When you create a new bot, you will get response like below.
Use this token to access the HTTP API:
1254341629:AAHYHhJK8TgsUXa7jqBK7wU1bJ8hzWhUFzs
Keep your token secure and store it safely, it can be used by anyone to control your bot.
- Open Telegram and search for @BotFather user and send the following command.
- Create a Channel and retrieve the channel’s chat ID.
- Create a channel in telegram and Invite your bot as an admin
- Send a test message and Get the Chat ID
- Use cURL or just visit the url below with your browser. Don’t forget to replace the access token
https://api.telegram.org/bot{USE_YOUR_ACCESS_TOKEN}/getUpdates - You will get the lines like below.
{"ok":true,"result":[{"update_id":222389875, "channel_post":{"message_id":2,"chat": {"id":-1001181377238,"title":"test","type":"channel"},"date":1587016720,"text":"test"}}]} - Save the id number:
-1001181377238because we’ll need it in the next step
Configure Grafana Notification
We have configured the chatbot above. Now let’s start to configure Grafana Notification.
- Login to Grafana web panel via
http://your_grafana_server:3000 - Click Alerting / Notification Channel
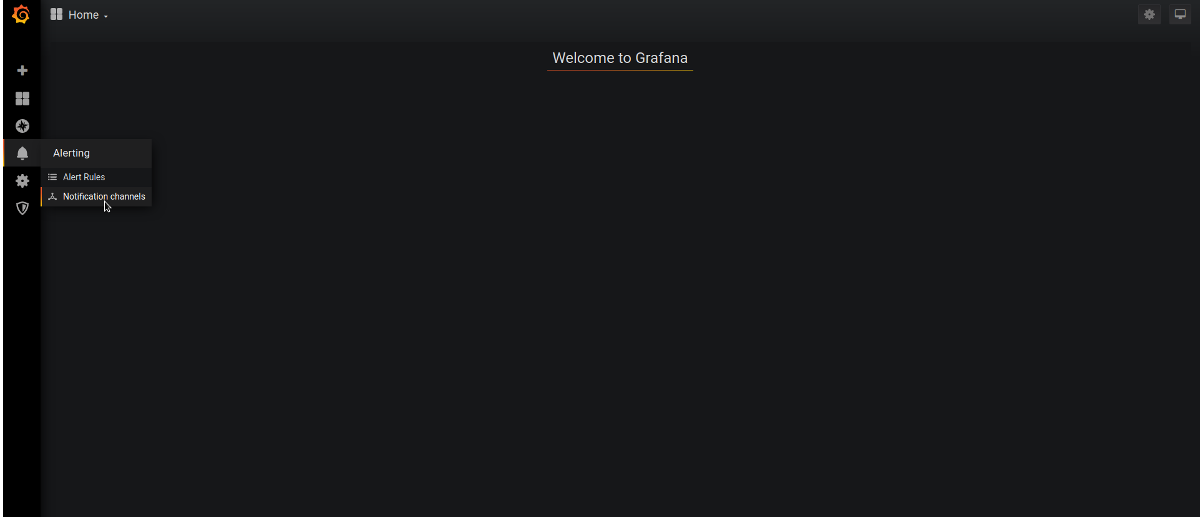
- Add New Channel
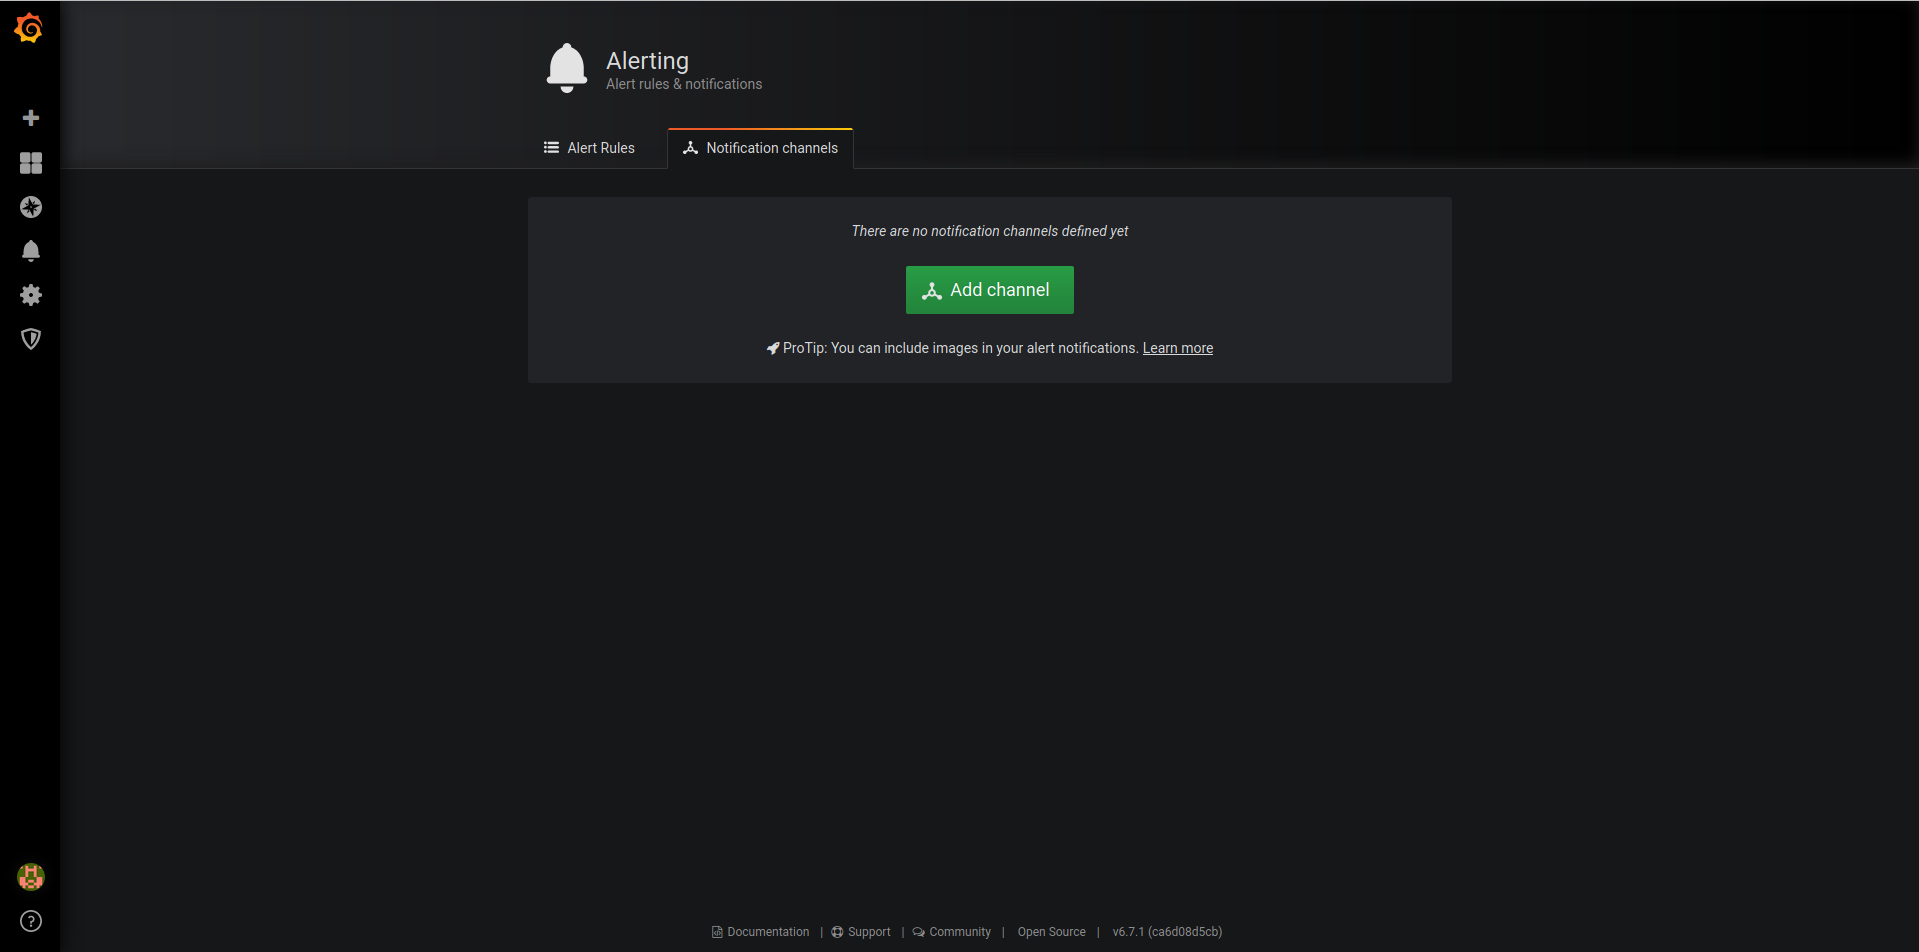
- Configure it as shown in the below screenshot
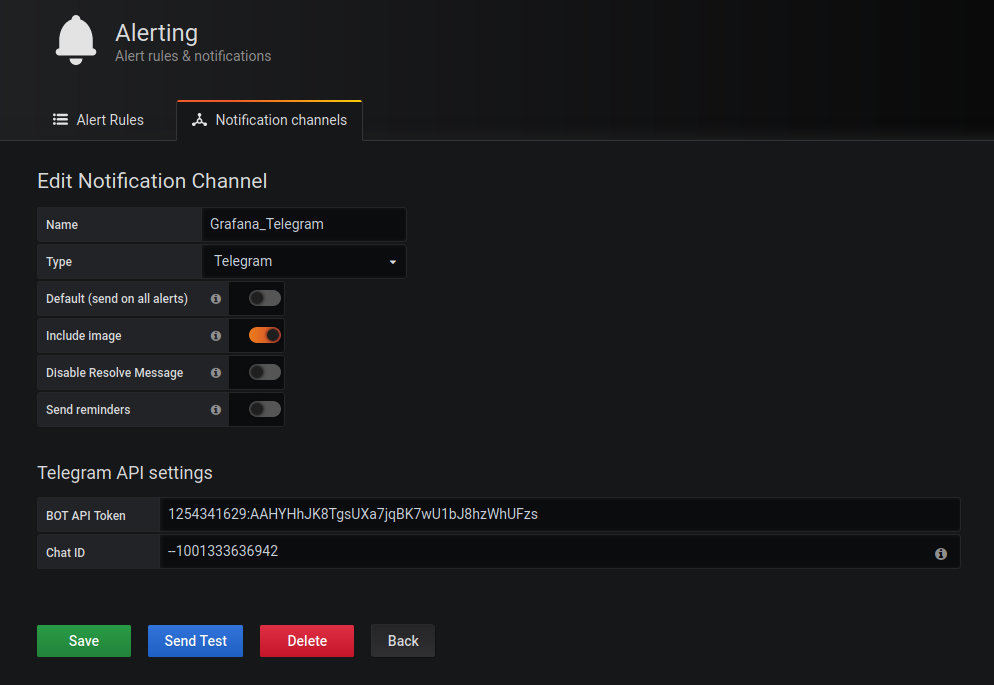
Name : name_of_your_notification.
Type : Telegram
Bot Api Token: your_bot_token_id
Chat ID: your_channel_id
If you click on the Send Test and there is a message on the telegram, everything is fine.
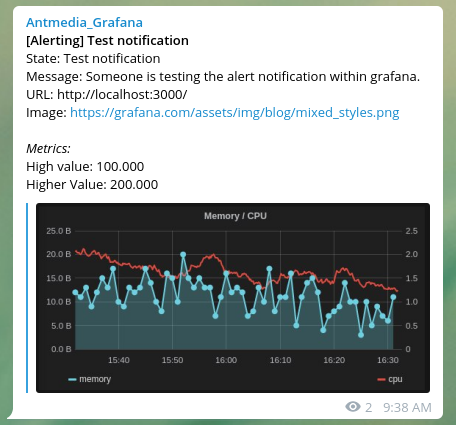
Now you’ve set up notifications as you wish.
This is the whole setup of monitoring Ant Media Server. If you have any questions, please just drop a line to contact (at) antmedia.io