Video analytics has emerged as a transformative tool in the world of live streaming analytics enabling better viewer engagement and retention by utilizing actionable data from the video player.
Content creators can address playback problems proactively to prevent any negative impact on the audience, and consistently optimize for the best viewing experience. By harnessing this technology, live streamers can also gain valuable information about their viewers, such as their location, device preferences, and viewing behaviours.
This data-driven approach empowers broadcasters to optimize content delivery, detect errors promptly, and create more personalised viewing experiences, resulting in heightened engagement and increased success.
Introducing the Bitmovin Video Analytics Integration with Ant Media Server
Bitmovin offers a video analytics platform that is designed to provide insights into the performance of online video content.
It offers real-time streaming analytics on video delivery and playback performance, user engagement, and content quality by harnessing advanced video streaming analytics technology to collect data and metrics from video elements.
With the Ant Media Bitmovin Video Analytics Integration, video publishers can monitor and get insights into various indicators (KPIs) such as the type of client (Publisher or Player), the publishing or playing protocol, geo-location, the type of device used and video startup time among other live streaming analytics data.
This integration enhances Ant Media Server live streams to help optimize video streaming content, identify and fix playback issues, and improve the overall viewer experience.
How can you Integrate Bitmovin into Ant Media Server?
Step 1: Get a Bitmovin analytics API key
1. Create an account at Bitmovin
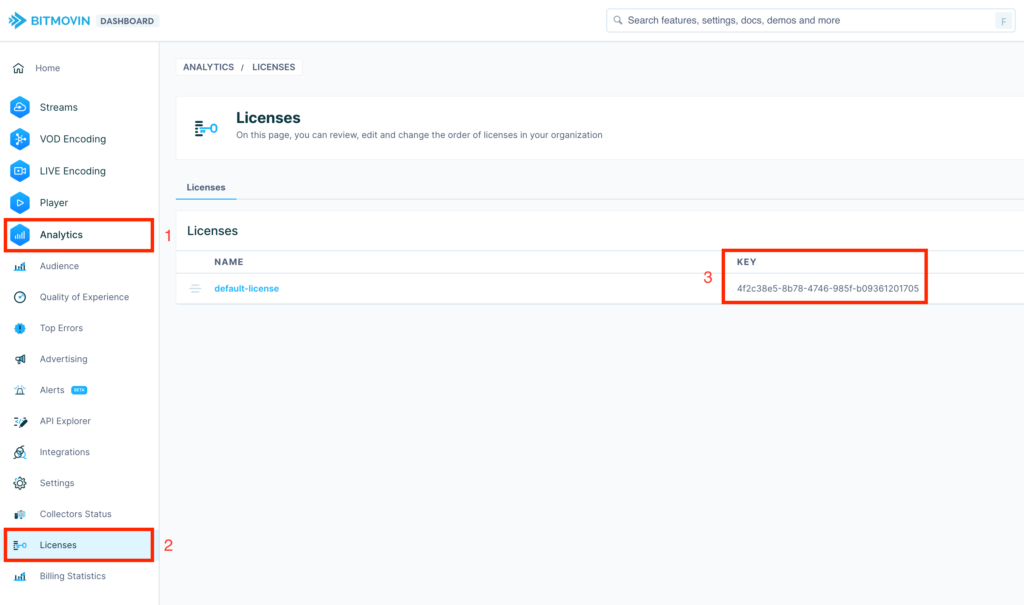
2. Navigate to the analytics section
3. Copy the Analytics license key
Step 2: Bitmovin Play/Publish Pages
We have prepared sample publish and play pages for your convenience that have already implemented video analytics tracking.
Navigate to Github and access the StreamApp repository under the bimovinAnaliticsSample branch.
Then navigate to the webapp folder to access all the example files.
The sample pages are located at:
- Publish:
https://github.com/ant-media/StreamApp/blob/bimovinAnaliticsSample/src/main/webapp/samples/publish_webrtc.html - Play:
https://github.com/ant-media/StreamApp/blob/bimovinAnaliticsSample/src/main/webapp/play.html
How has Bitmovin Video Analytics been integrated?
Both the publish page and play pages include the Bitmovin JavaScript file in the head section of the page.
  <head>
    <script type="text/javascript" src="https://cdn.bitmovin.com/analytics/web/2/bitmovinanalytics.min.js"></script>
  </head>
The main integration script that is being used to trigger the video usage tracking has also been imported. If you do not clone the entire branch, then you’ll need to download the integration script and make it available.
The Ant Media Bitmovin integration script is available in the same GitHub repository in the same branch.
Copy it to a location that’s accessible by your publish and play pages and import Analytics.
import {Analytics} from "./js/analytics.js" The Analytics object is then initialized as in the example below.
var analytics =new Analytics(bitmovinKey);Now Bitmovin is set to start tracking your video usage.
For instance, send usage data back to Bitmovin when publishing has started by simply calling the analyze() method inside the startPublishing() function.
analytics.analyze(Analytics.publisher,streamId,applicationName,customerId,Analytics.webrt
Step 3: Using Bitmovin License Key
The sample pages assume that you’ll pass the Bitmovin license key in the URL. So if you’ve cloned the branch and are running the sample pages, you can start tracking your video in Bitmovin by accessing the following pages:
publishing:  http://localhost:5080/{Application}?id=stream1&bitmovinKey=Your_API_KEY

playing :  http://localhost:5080/{Application}/play.html?id=stream1&bitmovinKey=Your_API_KEY
Notice how the API key is passed into the URL using the bitmovinKey query parameter.
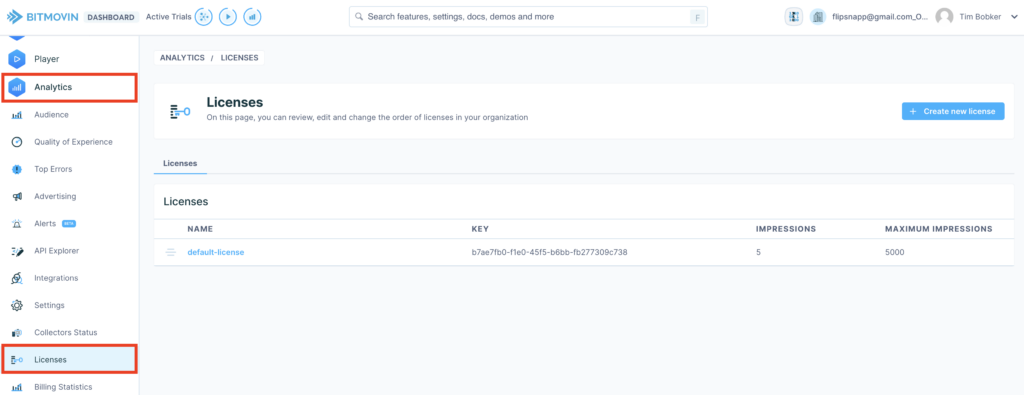
You can find the license key by navigating to Analytics > Licenses and clicking on the license you’ll want to use. In our case, it’s the default-license.
Step 4: Tracking individual Customers
Bitmovin also provides a feature to track individual customers. If you are integrating the publish and play pages into your website, you can also, pass a parameter for the customerId.
For example:
http://localhost:5080/WebRTCAppEE/play.html?id=stream1&bitmovinKey=Your_API_KEY&customerId=PASS_UNIQUE_ID
As an idea, you can generate unique customer IDs on your back end and pass them in the URL parameters. After that, you can track the individual customers and track the customer’s video analytics in the Bitmovin Dashboard.
Step 5: Using the Bitmovin Analytics Dashboard
Here are some examples of the type of video analytics metrics you can track using Bitmovin Analytics.
Viewer Count
This essential metric reveals the number of individuals engaged with your
livestream at any given moment. Analyse fluctuations in viewer count to uncover hidden patterns and optimize your content strategy.
Identify peak viewing periods to maximize your impact and make informed decisions
about scheduling and promotional tactics. With this knowledge, you can captivate your audience and take your livestream to new heights.
Engagement Rate
Measure the active involvement of your viewers during live streams. This metric encompasses comments, likes, shares, and reactions, reflecting the
level of interaction.
By monitoring the engagement rate, you evaluate audience interest, create captivating content, and cultivate a thriving community around your streams.
Peak Concurrent Viewers
This metric reveals the highest number of simultaneous viewers, offering
valuable insights into the scalability and capacity requirements of your
streaming infrastructure.
By understanding peak viewer loads, you can optimize your broadcasting setup and guarantee a seamless streaming experience for all, even during high-demand periods.
Average Watch Time
Discover the duration viewers stay engaged with your live stream through
average watch time. This metric reveals the level of viewer retention and interest in your content. By analysing average watch time, you can pinpoint segments that captivate viewers or areas that may lead to drop-offs.
Use this valuable insight to refine your content delivery, ensuring continuous engagement throughout your broadcast.
How to track streaming analytics using Bitmovin Dashboard?
Start by logging into the Bitmovin Dashboard and navigating to the Analytics > Audience tab.
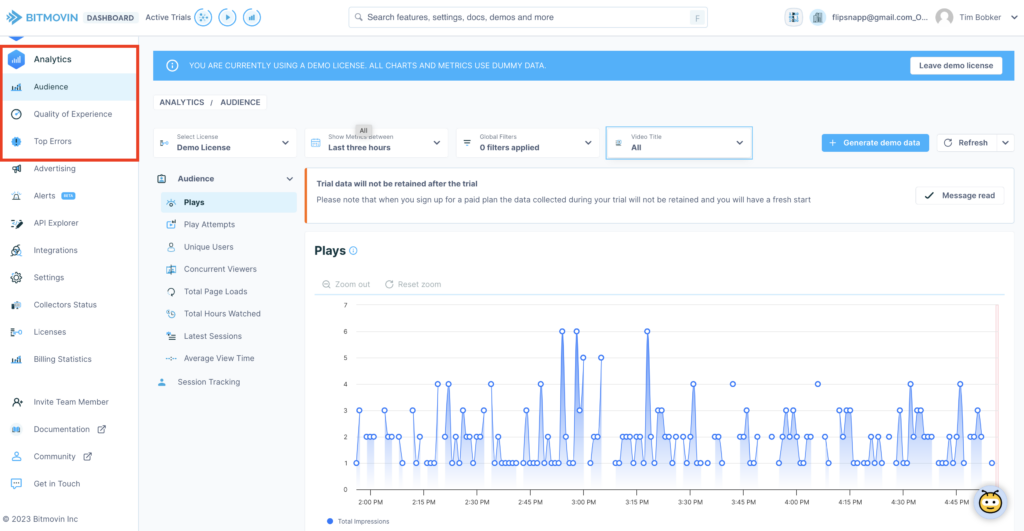
Once you’ve logged in, a page will load and provide you with various tabs to view your data.
In this example screenshot, we have generated some demo data for demonstration purposes, but once you start tracking video data, this is what it will look like once it’s populated.
Latest Sessions report
The latest sessions tab shows all the play and publish requests.
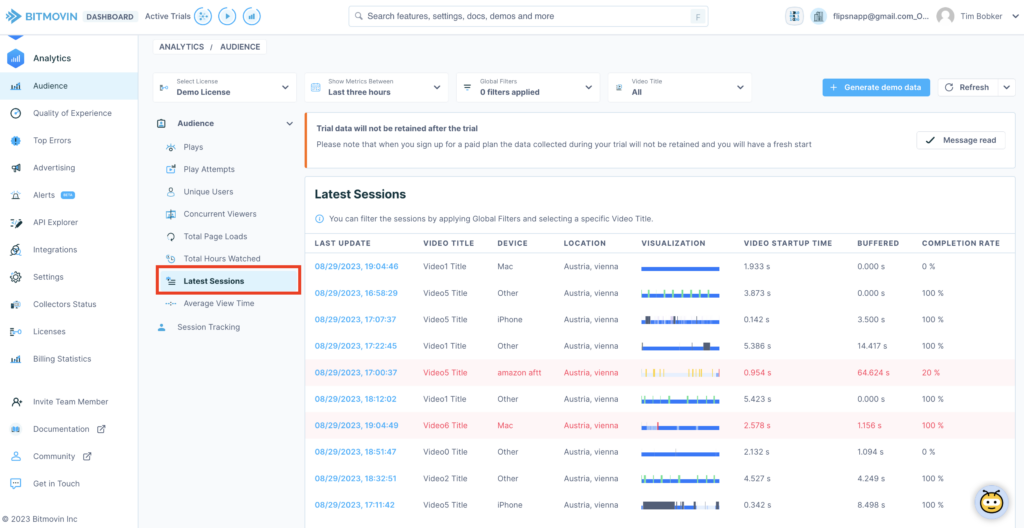
You can click on the session in the list and view additional video analytics data like startup time, player, device, codecs, and bitrates.
This information provides direct actionable insights into your audience and how they are consuming your video content.
How many people watched a particular video?
Although the Ant Media Server API provides an endpoint to see how many people are currently watching a video, it doesn’t save that data. You might want to see how many people watched a particular video in the past. To do that, click on the video title and the Video Id you are interested in.
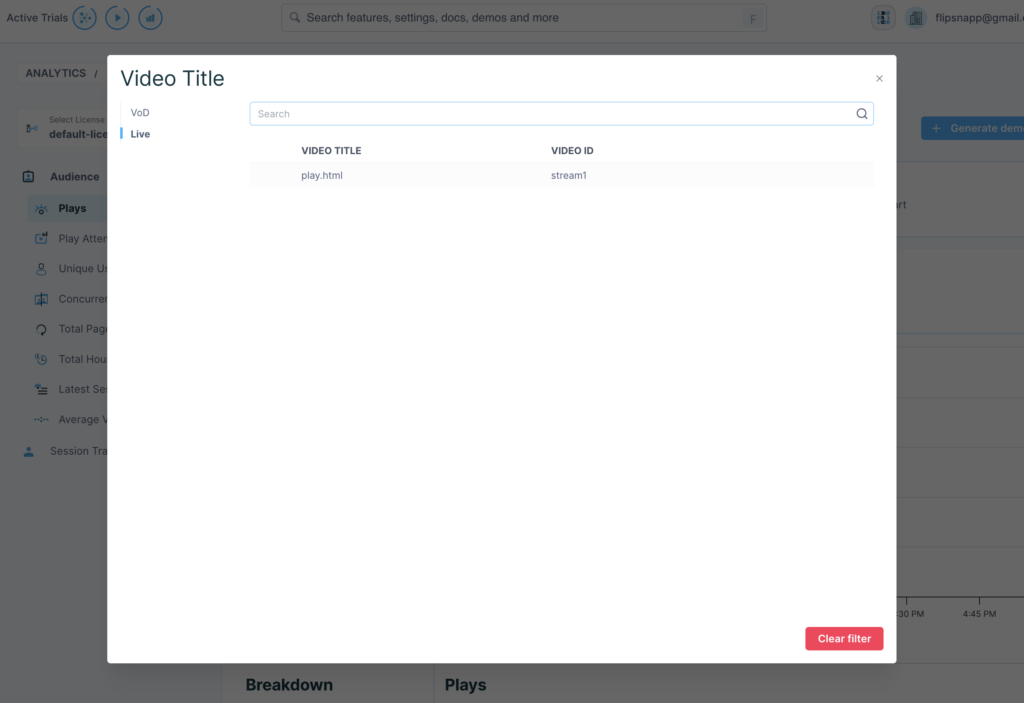
Go to the Video Title filter at the top and click the selection box:
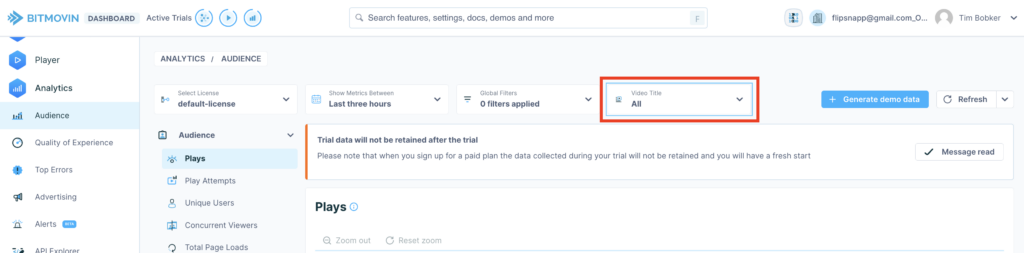
Then click on the title you are interested in:
Now the filter has been enabled for a particular video, you can select the Concurrent Viewers tab to see how many viewers watched the video over time.
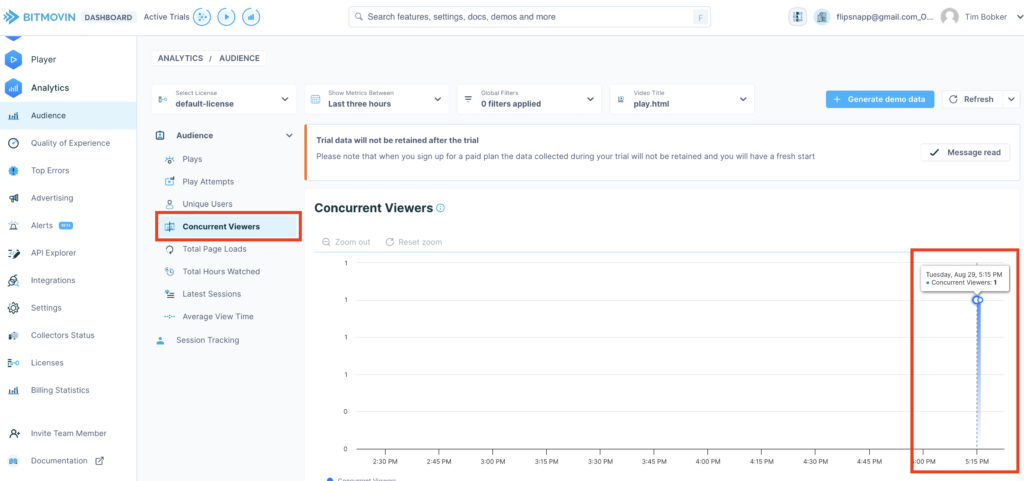
Because we used only one viewer watching the video in our example, it’s only showing one viewer in a single hour. However, if the video was playing for many hours with many concurrent viewers, then this chart will show more data.
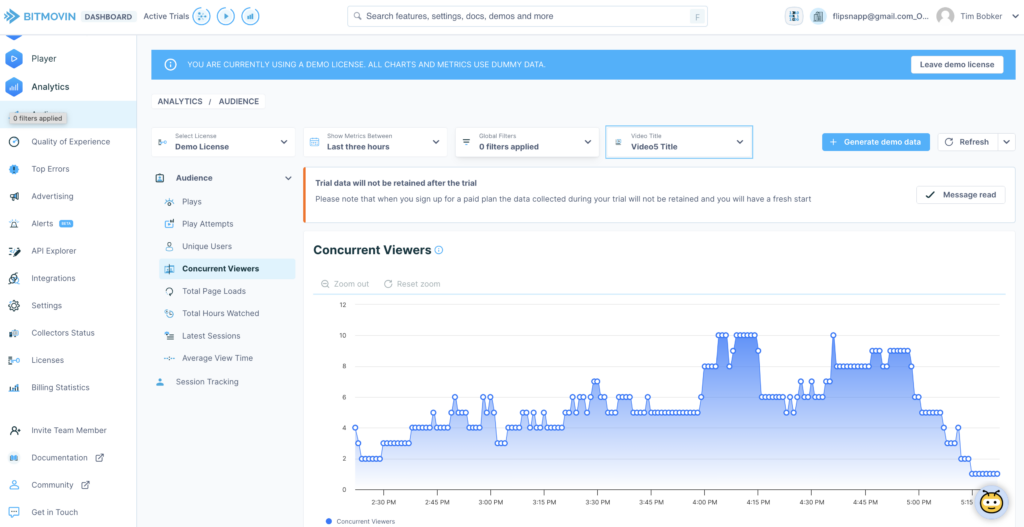
For example, in the demo license, demo data is populated, this is what it looks like:
Checking insights about individual customers
Elevate your streaming analytics with User ID tracking. This parameter helps you identify unique visitors and understand what each of them was doing in specific.
If you’ve implemented customer ID tracking, then to fetch the data from Bitmovin Analytics, you’ll need to navigate to the session tracking section. From here, all customer IDs that have been sent in the time period specified will show up.
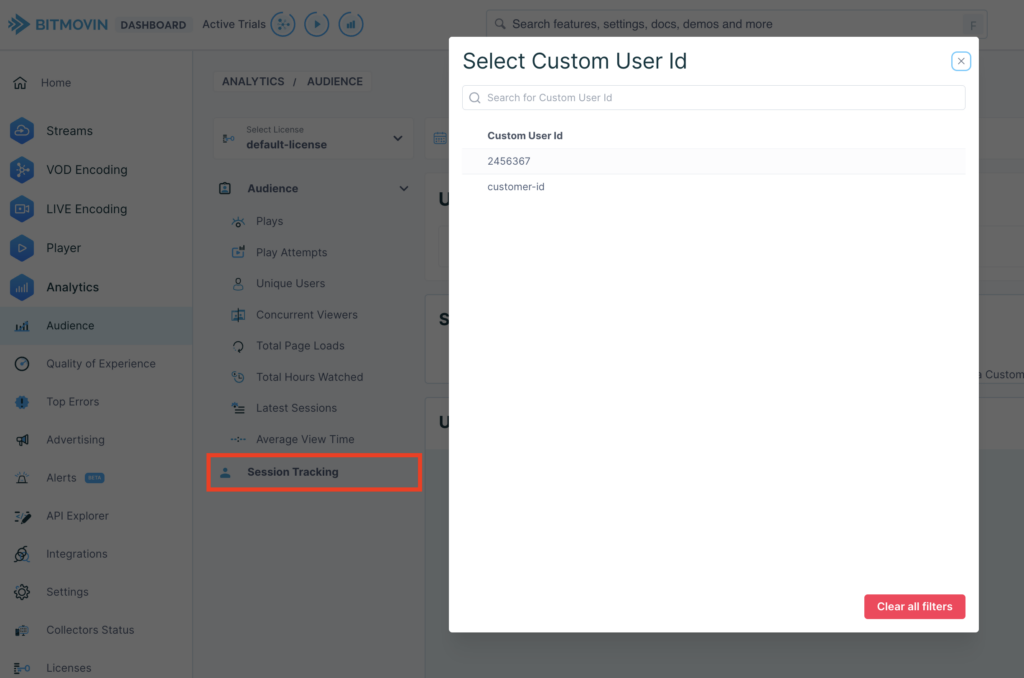
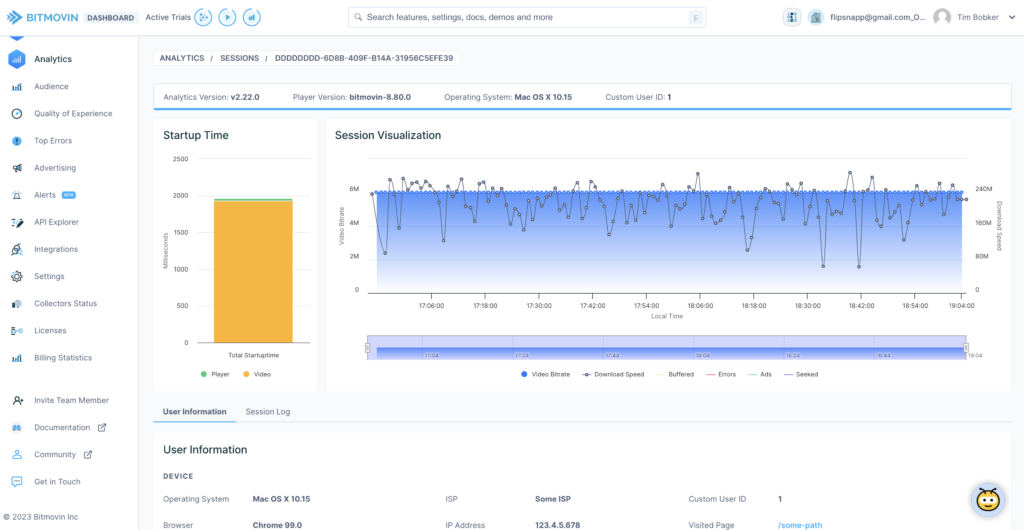
To view more details about the customer, click on the customer ID and all the sessions related to that customer will load.
In the example below, there is only one session because that customer only generated a single session in the time period.
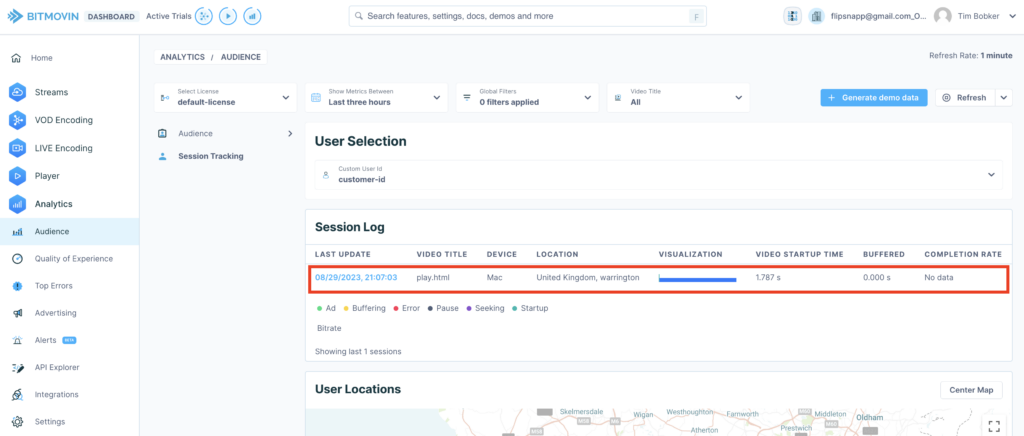
From here you can click on that session to view more video streaming analytics data, for instance, location, device, and screen size.
What Next?
View more Ant Media Server plugins and applications on the marketplace. Do you want to become a marketplace vendor yourself? Fill out this form and we will get back to your shortly.
Explore the JavaScript SDK reference guide and other popular SDKs, the documentation, or join the community discussions to learn more about the Ant Media Server.
Demos of Ant Media Server are available on the website and you can check out some of the popular SDKs in Github to integrate Ant Media Server into your mobile application.
Deployment options include other 1-click apps, cloud marketplaces, and Docker/Kubernetes/Scripts on various cloud providers such as AWS, Microsoft Azure, Digital Ocean, Linode, Google, and Alibaba.
A free trial is available to try out the Enterprise Edition of the product and support packages are available for both editions if you need some extra help getting started.